Bureau of National Statistics
of the Agency for Strategic Planning and Reforms of the Republic of Kazakhstan
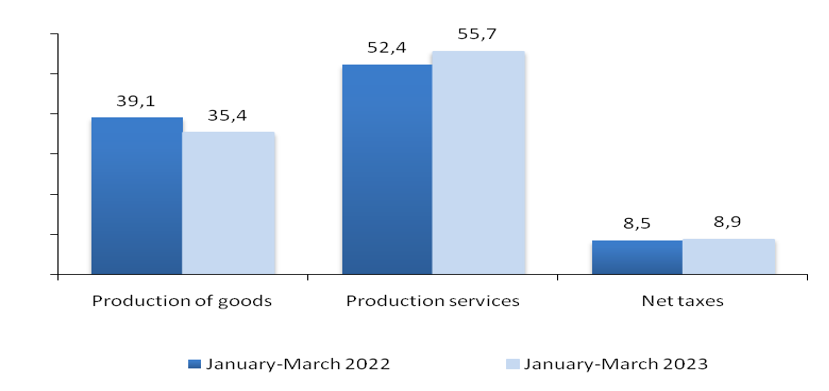
In January-March 2023 to the corresponding period of the previous year real growth of production of goods, production of services and taxes on products amounted - 4, 3%, 5, 3% and 7%.
| At current prices,million tenge | To the previous year, in percent | In percentages to the end | ||
|---|---|---|---|---|
| IPV | deflator | |||
| Gross domestic product | 23 582 637,0 | 105,0 | 114,9 | 100,0 |
| Production of goods | 8 340 185,4 | 104,3 | 104,6 | 35,4 |
| Agriculture, forestry and fisheries | 542 781,1 | 103,5 | 112,0 | 2,4 |
| Industry | 6 887 049,4 | 102,9 | 104,4 | 29,1 |
| Mining and quarrying | 3 041 150,5 | 100,2 | 98,5 | 12,8 |
| Manufacturing industry | 3 374 411,5 | 105,4 | 110,1 | 14,3 |
| Supply of electricity, gas, steam, hot water and air conditioning | 402 803,4 | 106,1 | 106,7 | 1,7 |
| Water supply; collection, treatment and disposal of waste, activities for the elimination of pollution | 68 684,0 | 106,7 | 106,7 | 0,3 |
| Construction | 910 354,9 | 115,7 | 101,5 | 3,9 |
| Service production | 13 138 785,0 | 105,3 | 122,0 | 55,7 |
| Wholesale and retail trade; car and motorcycle repair | 3 798 911,0 | 111,1 | 121,6 | 16,1 |
| Transport and warehousing | 1 342 075,8 | 107,6 | 109,8 | 5,7 |
| Provision of accommodation and food services | 227 758,0 | 102,8 | 129,7 | 1,0 |
| Information and communication | 410 940,0 | 112,0 | 108,1 | 1,7 |
| Financial and insurance activities | 890 258,5 | 101,5 | 124,4 | 3,8 |
| Operations with real estate | 1 924 522,9 | 101,5 | 129,3 | 8,1 |
| Professional, scientific and technical activities | 1 170 842,4 | 102,6 | 126,2 | 5,0 |
| Activities in the area of administration and support services | 515 538,2 | 101,0 | 125,1 | 2,2 |
| Public administration and defense; compulsory social security | 502 422,2 | 102,9 | 118,4 | 2,1 |
| Education | 941 988,1 | 102,4 | 117,5 | 4,0 |
| Public Health and Social Services | 622 225,7 | 101,3 | 128,0 | 2,6 |
| Arts, entertainment and recreation | 217 904,8 | 93,7 | 138,5 | 0,9 |
| Provision of other types of services | 554 612,0 | 102,2 | 126,2 | 2,4 |
| Activities of households employing domestic workers; activities of households producing goods and services for their own consumption | 18 785,4 | 102,0 | 120,0 | 0,1 |
| Gross value added | 21 478 970,4 | 104,8 | 114,6 | 91,1 |
| Taxes on products | 2 103 666,6 | 107,0 | 117,9 | 8,9 |
The shares of production of goods and production of services in GDP for January-March 2023 amounted to 35.4% and 55.7%, respectively. The main share in the production of GDP is the industry - 29.1%.
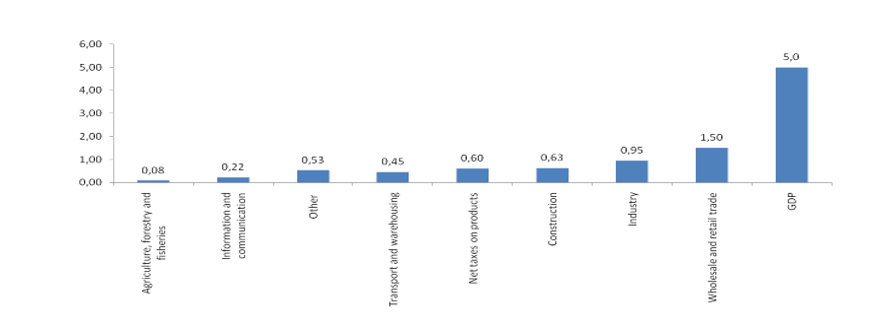
GDP increased by 5% in real terms compared to the corresponding period of the previous year. The largest growth was shown by construction (15.7%), information and communication (12%), Wholesale and retail trade; car and motorcycle repair (11.1%), transport and warehousing (7.6%), Water supply; collection, treatment and disposal of waste, activities for the elimination of pollution (6.7%), Supply of electricity, gas, steam, hot water and air conditioning (6.1%).
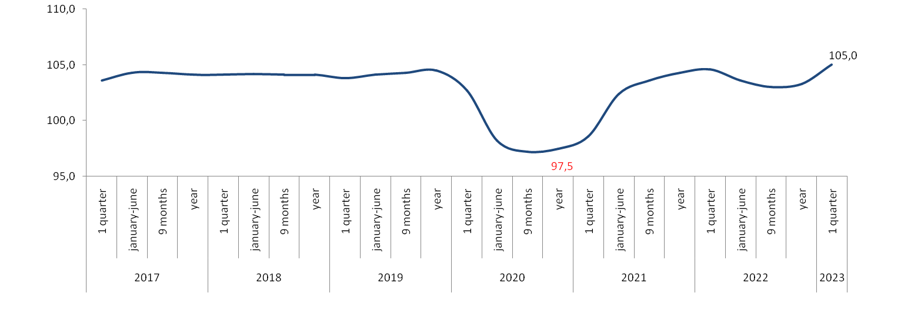
In dynamics over the past 5 years, there has been a decline in economic activity in 2020 due to the pandemic caused by Covid-19, as well as the introduction of restrictive measures (real GDP growth -2.5 %).
Starting from the 2nd quarter of 2021, there has been a gradual economic recovery .
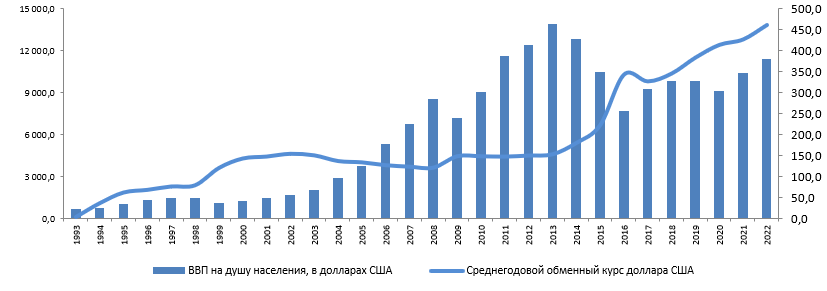
GDP per capita in 2022 (preliminary data) amounted to 11 380.5 US dollars.
The level of the non-observed economy in GDP in 2021 decreased by 0.48% and amounted to 19.75% of GDP, of which the share of illegal activities is 1.35% of GDP.
The largest shares of the non-observed economy in GDP are in Transport and warehousing (2.92%), Wholesale and retail trade; repair of cars and motorcycles (2.77%) and Agriculture, forestry and fisheries (2.54%), the smallest - in Financial and insurance activities (0.08%), Mining and quarrying (0.08%), and water supply; collection, processing and disposal of waste, activities for the elimination of pollution (0.08%).
| 2017 | 2018 | 2019 | 2020 | 2021 | |
|---|---|---|---|---|---|
| Production of goods | 7,64 | 6,90 | 5,65 | 5,19 | 6,26 |
| Service production | 21,11 | 20,12 | 18,04 | 15,04 | 13,49 |
| Total | 28,75 | 27,02 | 23,69 | 20,23 | 19,75 |
Labor productivity for 2021 in the economy as a whole amounted to 8423.4 thousand tenge per employee and showed an increase of 0.7% in real terms compared to the previous year
Gross domestic product (GDP) is one of the most important indicators of the system of national accounts, characterizing the final result of the country's economic activity.
Gross value added is the value of gross output minus the value of intermediate consumption, which serves as an indicator of the contribution to GDP made by individual producers, industries or sectors of the economy.
Gross output is the output of goods and services, representing the total value of goods and services resulting from the production activities of resident units of the national economy in the reporting period.
Intermediate consumption is the value of goods and services that are transformed or completely consumed in the production process.
A deflator is an indicator that characterizes the average change in prices in the economy over a certain period.
Contribution - the value of the influence of the percentage change in the indicator on the total value of GDP.
Taxes on products include taxes, the amount of which directly depends on the cost of goods produced and services rendered.
Gross domestic product by production is the sum of gross value added by economic activity, which is increased by net taxes on products and on imports. The term "net" means that taxes are shown net of related subsidies.


