Bureau of National Statistics
of the Agency for Strategic Planning and Reforms of the Republic of Kazakhstan
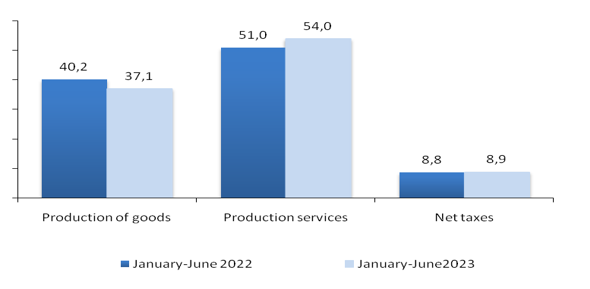
In January-June 2023 to the corresponding period of the previous year real growth of production of goods, production of services and taxes on products amounted – 4,8%, 5,5% and 7%.
| At current prices, million tenge | To the previous year, in percent | In percentages to the end | ||
|---|---|---|---|---|
| PVI | deflator | |||
| Gross domestic product | 47 244 671,5 | 105,3 | 112,7 | 100,0 |
| Production of goods | 17 456 038,1 | 104,8 | 102,4 | 37,1 |
| Agriculture, forestry and fisheries | 1 276 262,0 | 103,2 | 111,5 | 2,8 |
| Industry | 13 854 450,8 | 103,8 | 101,4 | 29,4 |
| Mining and quarrying | 6 786 106,0 | 103,7 | 95,3 | 14,4 |
| Manufacturing industry | 6 182 096,6 | 103,4 | 107,8 | 13,1 |
| Supply of electricity, gas, steam, hot water and air conditioning | 755 196,9 | 106,8 | 109,2 | 1,6 |
| Water supply; collection, treatment and disposal of waste, activities for the elimination of pollution | 131 051,3 | 106,4 | 106,7 | 0,3 |
| Construction | 2 325 325,3 | 112,3 | 104,1 | 4,9 |
| Service production | 25 563 787,2 | 105,5 | 121,1 | 54,0 |
| Wholesale and retail trade; car and motorcycle repair | 7 379 424,0 | 110,4 | 117,9 | 15,6 |
| Transport and warehousing | 2 767 909,5 | 107,4 | 114,9 | 5,9 |
| Provision of accommodation and food services | 377 404,1 | 106,3 | 116,8 | 0,8 |
| Information and communication | 978 405,7 | 115,6 | 112,8 | 2,1 |
| Financial and insurance activities | 1 885 914,3 | 101,3 | 131,6 | 4,0 |
| Operations with real estate | 3 525 276,9 | 102,4 | 133,7 | 7,5 |
| Professional, scientific and technical activities | 1 821 854,1 | 102,7 | 124,2 | 3,8 |
| Activities in the area of administration and support services | 966 491,6 | 100,4 | 126,3 | 1,9 |
| Public administration and defense; compulsory social security | 1 039 819,0 | 103,0 | 115,5 | 2,2 |
| Education | 2 186 669,0 | 102,1 | 117,0 | 4,6 |
| Public Health and Social Services | 1 149 391,9 | 101,3 | 118,8 | 2,5 |
| Arts, entertainment and recreation | 349 180,5 | 100,4 | 117,9 | 0,7 |
| Provision of other types of services | 1 101 779,8 | 101,0 | 124,5 | 2,3 |
| Activities of households employing domestic workers; activities of households producing goods and services for their own consumption | 34 266,8 | 101,5 | 117,8 | 0,1 |
| Gross value added | 43 019 825,3 | 105,2 | 112,8 | 91,1 |
| Taxes on products | 4 224 846,2 | 107,0 | 112,4 | 8,9 |
The shares of production of goods and production of services in GDP for January-June 2023 amounted to 37,1% and 54,0%, respectively. The main share in the production of GDP is the industry – 29,4%.
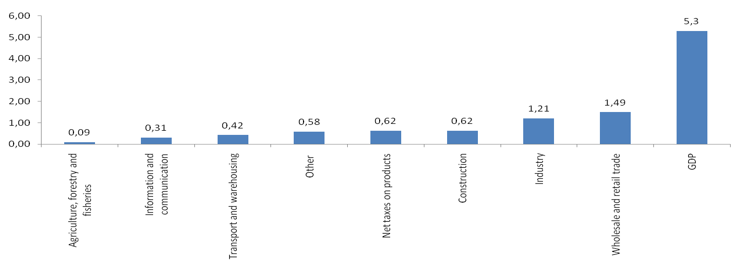
GDP increased by 5,3% in real terms compared to the corresponding period of the previous year. The largest growth was shown by information and communication (15,6%), construction (12,3%), Wholesale and retail trade; car and motorcycle repair (10,4%), transport and warehousing (7,4%), Supply of electricity, gas, steam, hot water and air conditioning (6,8%), Water supply; collection, treatment and disposal of waste, activities for the elimination of pollution (6.4%).
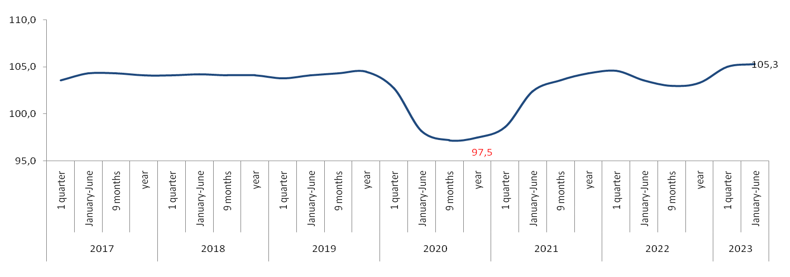
In dynamics over the past 5 years, there has been a decline in economic activity in 2020 due to the pandemic caused by Covid-19, as well as the introduction of restrictive measures (real GDP growth -2,5 %).
Starting from the 2nd quarter of 2021, there has been a gradual economic recovery.
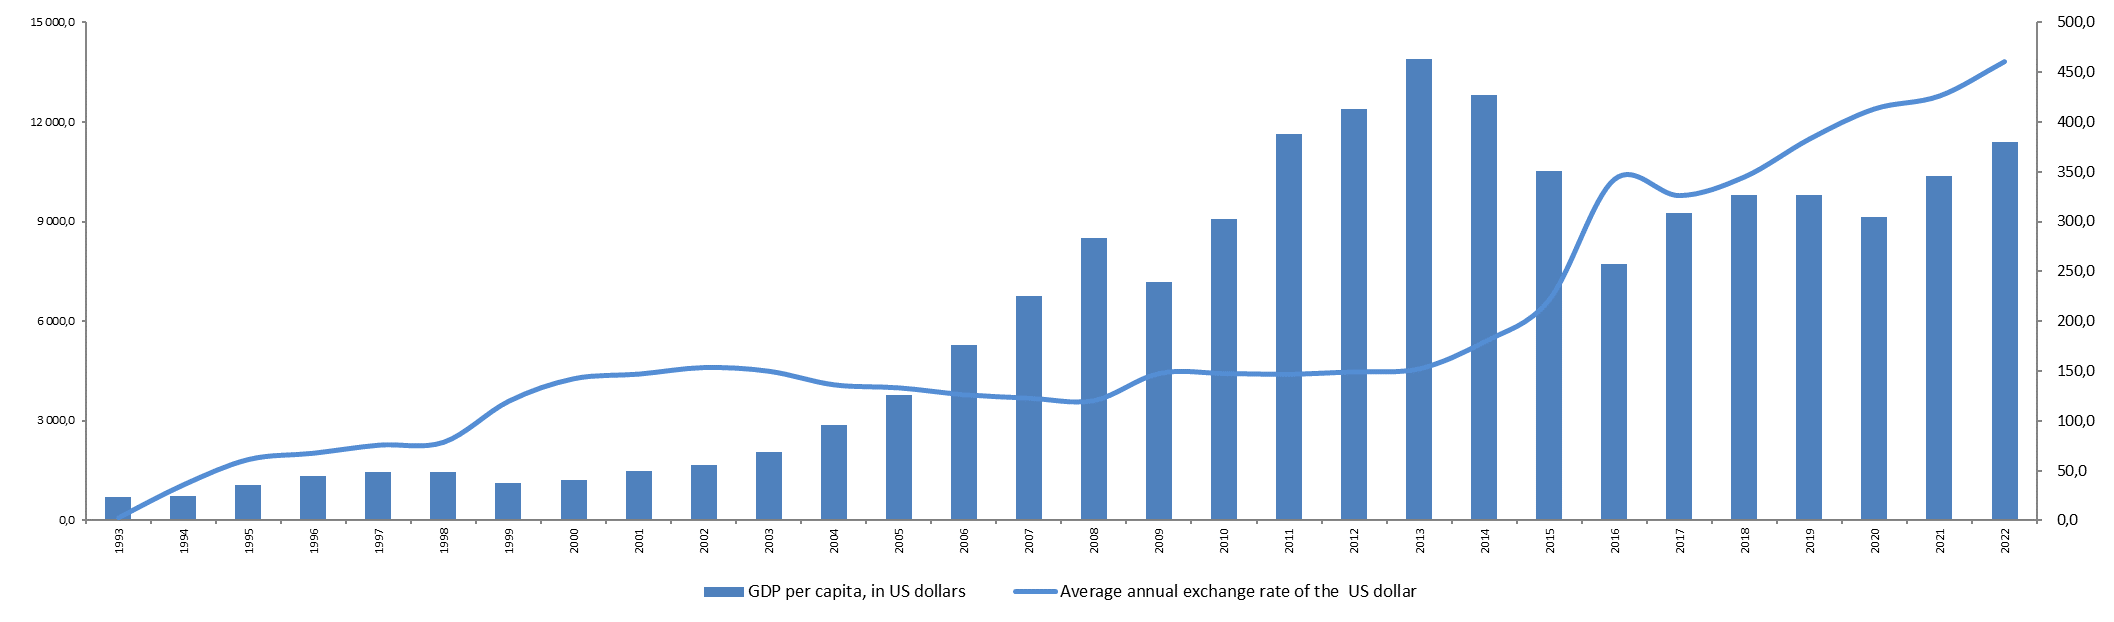
GDP per capita in 2022 (a reported data) amounted to 11476,6 US dollars.
In dynamics over the past 5 years, there has been a decline in economic activity in 2020 due to the pandemic caused by Covid-19, as well as the introduction of restrictive measures (real GDP growth -2,5 %).
Starting from the 2nd quarter of 2021, there has been a gradual economic recovery.
The level of the non-observed economy in GDP in 2022 decreased by 0,97% and amounted to 18,78% of GDP, of which the share of illegal activities is 1,15% of GDP.
The largest shares of the non-observed economy in GDP are in Wholesale and retail trade; repair of cars and motorcycles (3,14%), Construction(2,64%) and Transportation and storage (2,54%), the smallest - in and water supply; collection, processing and disposal of waste, activities for the elimination of pollution(0,04%), Arts, entertainment and recreation (0,07%), Mining and quarrying (0,14%).
| 2018 | 2019 | 2020 | 2021 | 2022 | |
|---|---|---|---|---|---|
|
Production of goods |
6,90 | 5,65 | 5,19 | 6,26 | 7,01 |
|
Service production |
20,12 | 18,04 | 15,04 | 13,49 | 11,77 |
|
Total |
27,02 | 23,69 | 20,23 | 19,75 | 18,78 |
Labor productivity for 2022 in the economy as a whole amounted to 10 083,2 thousand tenge per employee and showed an increase of 1,3 % in real terms compared to the previous year.
Gross domestic product (GDP) is one of the most important indicators of the system of national accounts, characterizing the final result of the country's economic activity.
Gross value added is the value of gross output minus the value of intermediate consumption, which serves as an indicator of the contribution to GDP made by individual producers, industries or sectors of the economy.
Gross output is the output of goods and services, representing the total value of goods and services resulting from the production activities of resident units of the national economy in the reporting period.
Intermediate consumption is the value of goods and services that are transformed or completely consumed in the production process.
A deflator is an indicator that characterizes the average change in prices in the economy over a certain period.
Contribution - the value of the influence of the percentage change in the indicator on the total value of GDP.
Taxes on products include taxes, the amount of which directly depends on the cost of goods produced and services rendered.
Gross domestic product by production is the sum of gross value added by economic activity, which is increased by net taxes on products and on imports. The term "net" means that taxes are shown net of related subsidies.


