Bureau of National Statistics
of the Agency for Strategic Planning and Reforms of the Republic of Kazakhstan
In the structure of wages by type of economic activity, the largest shares are Wholesale and retail trade; repair of motor vehicles and motorcycles (16,94%), Education (13,07%) , Manufacturing (10,96%).
The smallest shares in the wage structure were the activities of households employing domestic workers; activities of households in the production of goods and services for their own consumption (0,13%), Water supply; collection, treatment and disposal of waste, clean-up activities (0,51 % ) and Accommodation and food service activities (0,95%).
| At current prices, million tenge | As a percentage of the total | |
|---|---|---|
| Gross domestic product | 47 244 671,5 | 100,0 |
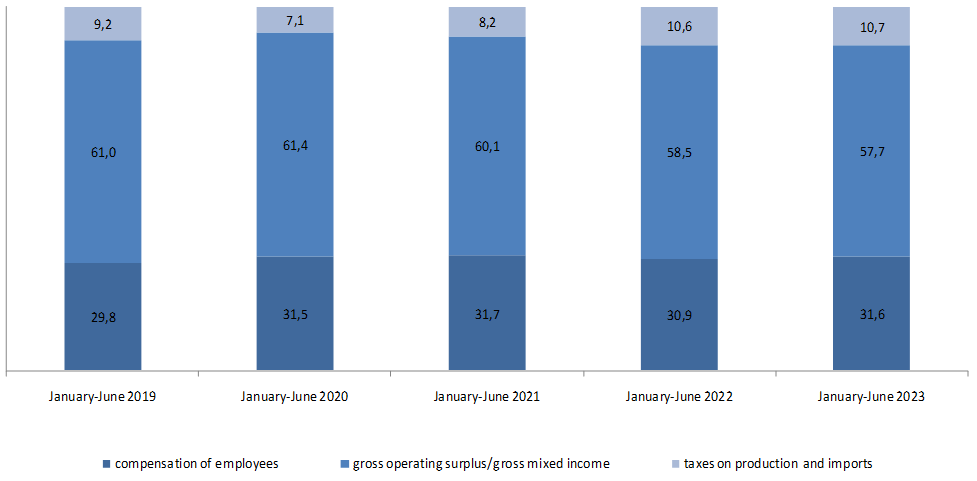
| Compensation of employees | 14 916 114,1 | 31,6 |
| Taxes on production and imports | 5 061 232,8 | 10,7 |
| including: | ||
| product taxes | 4 224 846,2 | 8,9 |
| other taxes on production | 836 386,6 | 1,8 |
| Gross operating surplus/gross mixed income | 27 267 324,6 | 57,7 |
| consumption of fixed capital (-) | 4 512 432,5 | 9,6 |
| net income/net mixed income | 22 754 892,1 | 48,1 |
* The balance method is used to calculate GDP by source of income.
| Gross value added | Including | |||
|---|---|---|---|---|
| compensation of employees | other taxes on production | gross operating surplus/gross mixed income | ||
| Production of goods | 17 456 038,1 | 4 835 520,9 | 365 572,5 | 12 254 944,7 |
| Agriculture, forestry and fishing | 1 276 262,0 | 411 978,0 | 8 018,8 | 856 265,2 |
| Industry | 13 854 450,8 | 3 524 384,5 | 317 137,3 | 10 012 929,0 |
| Mining and quarrying | 6 786 106,0 | 1 564 518,2 | 168 182,3 | 5 053 405,5 |
| Manufacturing | 6 182 096,6 | 1 634 448,0 | 104 025,1 | 4 443 623,5 |
| Electricity, gas, steam and air conditioning supply | 755 196,9 | 249 783,7 | 37 042,1 | 468 371,1 |
| Water supply; sewerage, waste management and remediation activities | 131 051,3 | 75 634,6 | 7 887,8 | 47 528,9 |
| Construction | 2 325 325,3 | 899 158,4 | 40 416,4 | 1 385 750,5 |
| Production of services | 25 563 787,2 | 10 080 593,2 | 470 814,1 | 15 012 379,9 |
| Wholesale and retail trade; repair of motor vehicles and motorcycles | 7 379 424,0 | 2 526 910,5 | 54 052,2 | 4 798 461,3 |
| Transportation and storage | 2 767 909,5 | 990 026,6 | 74 640,5 | 1 703 242,4 |
| Accommodation and food service activities | 377 404,1 | 140 978,7 | 10 374,6 | 226 050,8 |
| Information and communication | 978 405,7 | 427 473,9 | 22 978,1 | 527 953,7 |
| Financial and insurance activities | 1 885 914,3 | 509 304,5 | 34 636,1 | 1 341 973,7 |
| Real estate activities | 3 525 276,9 | 232 530,1 | 24 961,8 | 3 267 785,0 |
| Professional, scientific and technical activities | 1 821 854,1 | 717 434,3 | 36 645,5 | 1 067 774,3 |
| Administrative and support service activities | 966 491,6 | 501 425,1 | 30 047,0 | 435 019,5 |
| Public administration and defence; compulsory social | 1 039 819,0 | 790 017,5 | 33 820,0 | 215 981,5 |
| Education | 2 186 669,0 | 1 948 967,7 | 77 041,8 | 160 659,5 |
| Human health and social work activities | 1 149 391,9 | 795 603,3 | 46 729,5 | 307 059,1 |
| Arts, entertainment and recreation | 349 180,5 | 223 180,5 | 9 615,0 | 116 385,0 |
| Other service activities | 1 101 779,8 | 257 114,4 | 15 272,0 | 829 393,4 |
| Activities of households as employers; undifferentiated godds and services-producing activities of households for own use | 34 266,8 | 19 626,1 | 0,0 | 14 640,7 |
| Total by type of economic activity | 43 019 825,3 | 14 916 114,1 | 836 386,6 | 27 267 324,6 |
| Other taxes on production | 4 224 846,2 | - | - | - |
| Gross domestic product | 47 244 671,5 | |||
| Gross value added | Including | |||
|---|---|---|---|---|
| compensation of employees | other taxes on production | gross operating surplus/gross mixed income | ||
| Production of goods | 100,0 | 27,7 | 2,1 | 70,2 |
| Agriculture, forestry and fishing | 100,0 | 32,3 | 0,6 | 67,1 |
| Industry | 100,0 | 25,4 | 2,3 | 72,3 |
| Mining and quarrying | 100,0 | 23,1 | 2,5 | 74,4 |
| Manufacturing | 100,0 | 26,4 | 1,7 | 71,9 |
| Electricity, gas, steam and air conditioning supply | 100,0 | 33,1 | 4,9 | 62,0 |
| Water supply; sewerage, waste management and remediation activities | 100,0 | 57,7 | 6,0 | 36,3 |
| Construction | 100,0 | 38,7 | 1,7 | 59,6 |
| Production of services | 100,0 | 39,4 | 1,8 | 58,8 |
| Wholesale and retail trade; repair of motor vehicles and motorcycles | 100,0 | 34,2 | 0,7 | 65,1 |
| Transportation and storage | 100,0 | 35,8 | 2,7 | 61,5 |
| Accommodation and food service activities | 100,0 | 37,4 | 2,7 | 59,9 |
| Information and communication | 100,0 | 43,7 | 2,3 | 54,0 |
| Financial and insurance activities | 100,0 | 27,0 | 1,8 | 71,2 |
| Real estate activities | 100,0 | 6,6 | 0,7 | 92,7 |
| Professional, scientific and technical activities | 100,0 | 39,4 | 2,0 | 58,6 |
| Administrative and support service activities | 100,0 | 51,9 | 3,1 | 45,0 |
| Public administration and defence; compulsory social | 100,0 | 76,0 | 3,3 | 20,7 |
| Education | 100,0 | 89,1 | 3,5 | 7,4 |
| Human health and social work activities | 100,0 | 69,2 | 4,1 | 26,7 |
| Arts, entertainment and recreation | 100,0 | 63,9 | 2,8 | 33,3 |
| Other service activities | 100,0 | 23,3 | 1,4 | 75,3 |
| Activities of households as employers; undifferentiated godds and services-producing activities of households for own use | 100,0 | 57,3 | 0,0 | 42,7 |
| Total by type of economic activity | 100,0 | 34,7 | 1,9 | 63,4 |
Gross domestic product (GDP) is one of the most important indicators of the system of national accounts, characterizing the final result of the country's economic activity.
Gross value added is the value of gross output minus the value of intermediate consumption, which serves as an indicator of the contribution to GDP made by individual producers, industries or sectors of the economy.
Compensation of employees - the sum of all remuneration in cash and / or in kind, paid by employers to employees for the work performed during the reporting period.
Taxes on products include taxes, the amount of which directly depends on the cost of goods produced and services rendered.
Other taxes on production consist of all taxes levied on producing units in connection with their production or the use of factors of production, excluding taxes on products. The amount of such taxes does not directly depend on the volume and profitability of production.
Consumption of fixed capital represents a decrease in the value of fixed capital during the reporting period as a result of its physical and moral wear and tear and accidental damage.
The gross (net) profit operating surplus of the economy is that part of the value added that remains with producers after deducting the costs associated with paying workers and paying taxes on production. The term "gross" or "net" in this case indicates whether this indicator includes or does not include the consumption of fixed capital in the production process.
Gross domestic product, derived from the income method determines its structure on the basis of primary incomes: wages of employees, net taxes on production and imports, profits and mixed income.


