Bureau of National Statistics
of the Agency for Strategic Planning and Reforms of the Republic of Kazakhstan
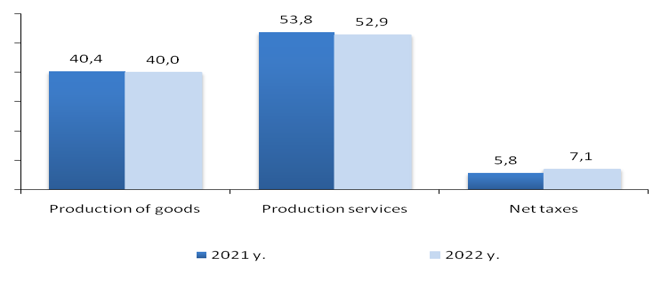
In 2022 year to the previous year real growth of production of goods, production of services and taxes on products amounted – 3,5%, 2,5% and 7,9%.
| At current prices, million tenge | To the previous year, in percent | In percentages to the end | |||
|---|---|---|---|---|---|
| IPV | deflator | ||||
| Gross domestic product | 103 765 518,2 | 103,2 | 119,7 | 100,0 | |
| Production of goods | 41 741 280,1 | 103,5 | 119,3 | 40,0 | |
| Agriculture, forestry and fisheries | 5 444 727,3 | 109,1 | 118,2 | 5,2 | |
| Industry | 30 841 860,5 | 101,2 | 122,7 | 29,5 | |
| Mining and quarrying | 15 210 887,2 | 99,1 | 129,1 | 14,5 | |
| Manufacturing industry | 13 929 790,7 | 103,6 | 117,7 | 13,4 | |
| Supply of electricity, gas, steam, hot water and air conditioning | 1 452 458,8 | 100,4 | 110,4 | 1,4 | |
| Water supply; collection, treatment and disposal of waste, activities for the elimination of pollution | 248 723,8 | 95,8 | 118,1 | 0,2 | |
| Construction | 5 454 692,3 | 110,2 | 103,9 | 5,3 | |
| Service production | 54 626 235,4 | 102,5 | 117,7 | 52,9 | |
| Wholesale and retail trade; car and motorcycle repair | 17 046 877,7 | 104,6 | 115,6 | 16,4 | |
| Transport and warehousing | 6 391 443,3 | 101,3 | 110,3 | 6,2 | |
| Provision of accommodation and food services | 1 052 069,3 | 102,6 | 126,2 | 1,0 | |
| Information and communication | 2 109 087,4 | 99,0 | 109,1 | 2,1 | |
| Financial and insurance activities | 3 171 635,7 | 103,1 | 126,2 | 3,1 | |
| Operations with real estate | 6 732 562,0 | 101,4 | 121,0 | 6,5 | |
| Professional, scientific and technical activities | 3 427 482,3 | 94,2 | 117,1 | 3,3 | |
| Activities in the area of administration and support services | 2 219 160,6 | 103,5 | 123,1 | 2,1 | |
| Public administration and defense; compulsory social security | 1 961 063,2 | 103,1 | 124,1 | 1,9 | |
| Education | 4 224 630,8 | 104,9 | 124,1 | 4,1 | |
| Public Health and Social Services | 2 959 635,6 | 103,0 | 116,8 | 2,9 | |
| Arts, entertainment and recreation | 928 891,5 | 102,7 | 123,7 | 0,9 | |
| Provision of other types of services | 2 338 955,0 | 104,9 | 118,6 | 2,3 | |
| Activities of households employing domestic workers; activities of households producing goods and services for their own consumption | 62 741,0 | 101,5 | 115,0 | 0,1 | |
| Gross value added | 96 367 515,5 | 102,9 | 118,4 | 92,9 | |
| Net taxes on products | 7 398 002,7 | 107,9 | 141,2 | 7,1 | |
| Taxes on products | 7 779 408,5 | 107,9 | 139,7 | 7,5 | |
| Subsidies on products | 381 405,8 | 107,9 | 115,7 | 0,4 | |
| 2022 year Mln. tenge | in percent | ||
|---|---|---|---|
| Index of physical volume, in percent to previous year | share of GDP | ||
| Oil and gas sector | |||
| Gross value added | 20 172 443,5 | 99,2 | 19,5 |
| Primary sector | |||
| Extraction crude oil and natural gas; technical services in mining industry | 11 662 142,6 | 99,6 | 11,3 |
| total | 11 662 142,6 | 99,6 | 11,3 |
| Secondary sector | |||
| Production products of refined oil products | 1 138 795,4 | 102,0 | 1,1 |
| Construction works on laying oil and gas trunk pipelines | 27 026,4 | 34,6 | 0,0 |
| Construction works on laying local pipelines, including the subsidiary works | 107 359,5 | 133,8 | 0,1 |
| Other construction works (services) | 0,0 | 0,0 | |
| total | 1 273 181,3 | 99,9 | 1,2 |
| Tertiary sector | |||
| Wholesale trade of crude oil and associated gas | 1 367 013,5 | 123,5 | 1,3 |
| Wholesale natural (fuel) gas | 288 863,0 | 86,3 | 0,3 |
| Wholesale trade services, except on a fee or contract basis, liquid and gaseous fuels and other products of the same | 3 272 854,9 | 95,0 | 3,2 |
| Wholesale of aviation gasoline and kerosene | 28 834,0 | 91,7 | 0,0 |
| Wholesale diesel | 416 336,0 | 87,3 | 0,4 |
| Wholesale fuel oil | 56 226,6 | 159,0 | 0,1 |
| Retail trade services of automotive fuel | 370 212,0 | 90,9 | 0,4 |
| Railway transport services of freight by tanker cars, petroleum products | 103 051,8 | 118,1 | 0,1 |
| Road transport services of freight by tank trucks or semi-trailers, petroleum products | 14 899,6 | 182,2 | 0,0 |
| Transport services via pipeline of crude or refined petroleum and petroleum products | 318 049,7 | 98,2 | 0,3 |
| Transport services via pipeline of natural gas | 842 613,9 | 92,2 | 0,8 |
| Services on carrying out geological exploration and research (research of oil and gas fields without research and development) | 106 055,1 | 159,3 | 0,1 |
| Mineral exploration and evaluation services | 37 649,8 | 144,6 | 0,0 |
| Surface surveying services | 76,7 | 19,5 | 0,0 |
| Rental services of machinery and equipment without operator for oil fields | 14 383,0 | 58,0 | 0,0 |
| total | 7 237 119,6 | 123,5 | 7 |
| Gross value added without oil and gas sector | 76 195 072,0 | 103,9 | 73,4 |
| Raw sources sector | |||
| Gross value added | 20 655 614,5 | 101,7 | 19,9 |
| Crop and animal production, hunting and related service activities | 5 224 594,1 | 108,6 | 5,0 |
| Forestry and logging | 47 505,7 | 99,1 | 0,0 |
| Fisheries and aquaculture | 172 627,5 | 123,5 | 0,2 |
| Mining industry | 15 210 887,2 | 99,1 | 14,5 |
| Non-raw sources sector | |||
| Gross value added | 75 711 901,0 | 103,2 | 73 |
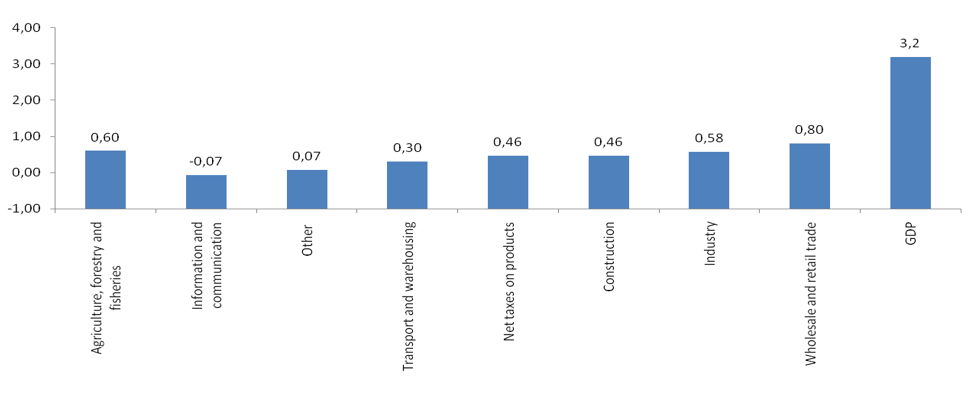
GDP increased by 3.2% in real terms compared to the corresponding period of the previous year. The largest growth was shown by construction (10,2%), Agriculture, forestry and fisheries (9.1%), Education (4,9%), Other service activities (4,9%), Wholesale and retail trade; repair of motor vehicles and motorcycles ( 4,6%), Activities of households as employers; undifferentiated goods and services-producing activities of households for own use (3.5%). The increase in taxes on products amounted to 7.9%.
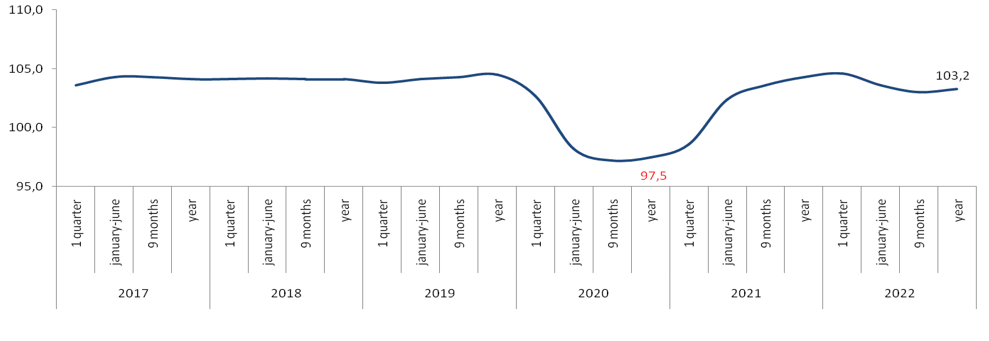
In dynamics over the past 5 years, there has been a decline in economic activity in 2020 due to the pandemic caused by Covid-19, as well as the introduction of restrictive measures (real GDP growth -2.5 %).
Starting from the 2nd quarter of 2021, there has been a gradual economic recovery .
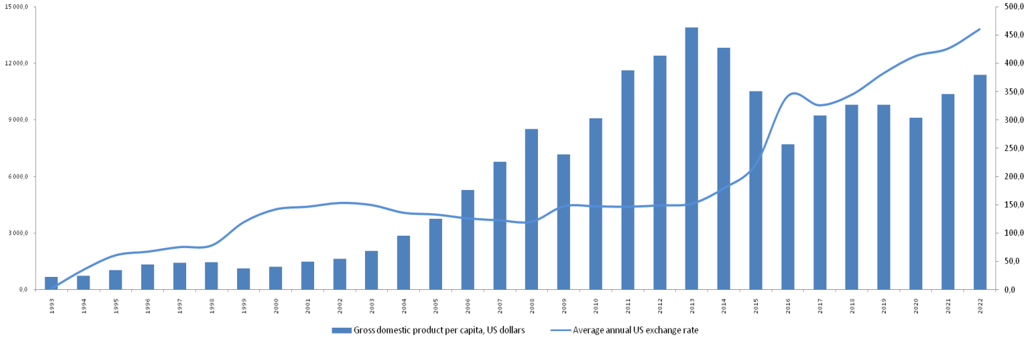
GDP per capita in 2022 year (a reported data) amounted to 11 476.6 US dollars.
The level of the non-observed economy in GDP in 2022 decreased by 0.97% and amounted to 18.78% of GDP, of which the share of illegal activities is 1.15% of GDP.
The largest shares of the non-observed economy in GDP are in Wholesale and retail trade; repair of cars and motorcycles (3,14%), Construction (2,64%) and Transportation and storage (2,54%), the smallest - in and water supply; collection, processing and disposal of waste, activities for the elimination of pollution (0.04%), Arts, entertainment and recreation (0,07%), Mining and quarrying (0,14%).
| 2018 | 2019 | 2020 | 2021 | 2022 | |
|---|---|---|---|---|---|
| Production of goods | 6.90 | 5.65 | 5.19 | 6.26 | 7,01 |
| Service production | 20.12 | 18.04 | 15.04 | 13.49 | 11,77 |
| Total | 27.02 | 23.69 | 20.23 | 19.75 | 18,78 |
Labor productivity for 2022 in the economy as a whole amounted to 10 083, 2 thousand tenge per employee and showed an increase of 1, 3% in real terms compared to the previous year.
Gross domestic product (GDP) is one of the most important indicators of the system of national accounts, characterizing the final result of the country's economic activity.
Gross value added is the value of gross output minus the value of intermediate consumption, which serves as an indicator of the contribution to GDP made by individual producers, industries or sectors of the economy.
Gross output is the output of goods and services, representing the total value of goods and services resulting from the production activities of resident units of the national economy in the reporting period.
Intermediate consumption is the value of goods and services that are transformed or completely consumed in the production process.
A deflator is an indicator that characterizes the average change in prices in the economy over a certain period.
Contribution - the value of the influence of the percentage change in the indicator on the total value of GDP.
Taxes on products include taxes, the amount of which directly depends on the cost of goods produced and services rendered.
Gross domestic product by production is the sum of gross value added by economic activity, which is increased by net taxes on products and on imports. The term "net" means that taxes are shown net of related subsidies.


