Bureau of National Statistics
of the Agency for Strategic Planning and Reforms of the Republic of Kazakhstan
In the structure of wages by type of economic activity, the largest shares are Wholesale and retail trade; repair of motor vehicles and motorcycles (18,72%), Manufacturing (12,0%) , Mining and quarrying (10,57%).
The smallest shares in the wage structure were the activities of households employing domestic workers; activities of households in the production of goods and services for their own consumption (0,10%), Water supply; collection, treatment and disposal of waste, clean-up activities (0,44 % ) and Real estate activities (1,30%).
| At current prices, million tenge | As a percentage of the total | |
|---|---|---|
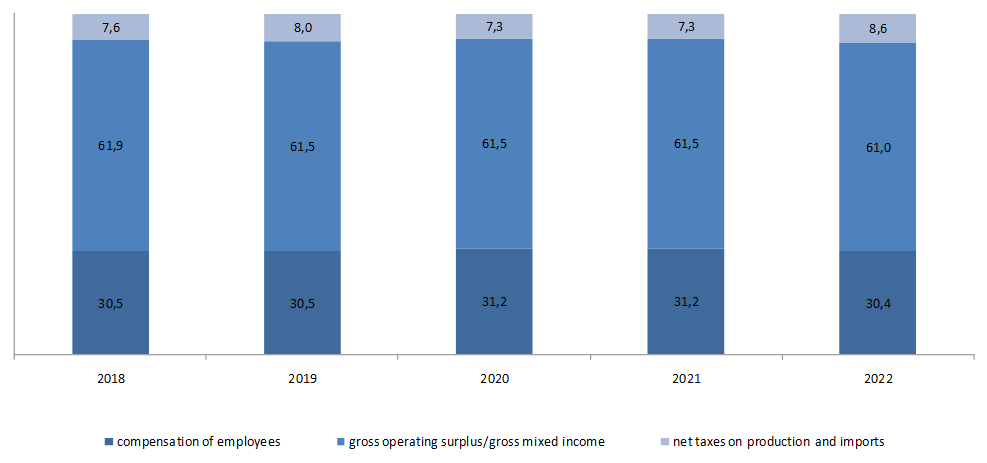
| Gross domestic product | 103 765 518,2 | 100,0 |
| Compensation of employees | 31 556 468,9 | 30,4 |
| Net taxes on production and imports | 8 902 814,5 | 8,6 |
| including: | ||
| product taxes | 7 779 408,5 | 7,5 |
| other taxes on production | 1 504 811,8 | 1,5 |
| subsidies on products | 381 405,8 | 0,4 |
| Gross operating surplus/gross mixed income | 63 306 234,8 | 61,0 |
| consumption of fixed capital (-) | 11 092 784,8 | 10,7 |
| net income/net mixed income | 52 213 450,0 | 50,3 |
* The balance method is used to calculate GDP by source of income.
| Gross value added | Including | |||
|---|---|---|---|---|
| compensation of employees | other taxes on production | gross operating surplus/gross mixed income | ||
| Production of goods | 41 741 280,1 | 11 449 359,3 | 621 348,7 | 29 670 572,1 |
| Agriculture, forestry and fishing | 5 444 727,3 | 1 243 446,1 | 14 131,1 | 4 187 150,1 |
| Industry | 30 841 860,5 | 7 888 461,5 | 527 797,0 | 22 425 602,0 |
| Mining and quarrying | 15 210 887,2 | 3 335 805,6 | 288 895,6 | 11 586 186,0 |
| Manufacturing | 13 929 790,7 | 3 786 960,7 | 164 323,1 | 9 978 506,9 |
| Electricity, gas, steam and air conditioning supply | 1 452 458,8 | 627 164,6 | 61 481,8 | 763 812,4 |
| Water supply; sewerage, waste management and remediation activities | 248 723,8 | 138 530,6 | 13 096,5 | 97 096,7 |
| Construction | 5 454 692,3 | 2 317 451,7 | 79 420,6 | 3 057 820,0 |
| Production of services | 54 626 235,4 | 20 107 109,6 | 883 463,1 | 33 635 662,7 |
| Wholesale and retail trade; repair of motor vehicles and motorcycles | 17 046 877,7 | 5 908 523,7 | 99 793,7 | 11 038 560,3 |
| Transportation and storage | 6 391 443,3 | 1 945 116,2 | 148 390,4 | 4 297 936,7 |
| Accommodation and food service activities | 1 052 069,3 | 415 137,6 | 15 086,6 | 621 845,1 |
| Information and communication | 2 109 087,4 | 812 863,2 | 123 113,4 | 1 173 110,8 |
| Financial and insurance activities | 3 171 635,7 | 1 169 355,6 | 54 101,5 | 1 948 178,6 |
| Real estate activities | 6 732 562,0 | 409 902,2 | 42 070,3 | 6 280 589,5 |
| Professional, scientific and technical activities | 3 427 482,3 | 1 343 000,9 | 65 974,8 | 2 018 506,6 |
| Administrative and support service activities | 2 219 160,6 | 1 130 719,0 | 48 902,0 | 1 039 539,6 |
| Public administration and defence; compulsory social | 1 961 063,2 | 1 503 035,2 | 60 841,3 | 397 186,7 |
| Education | 4 224 630,8 | 2 782 540,1 | 120 370,5 | 1 321 720,2 |
| Human health and social work activities | 2 959 635,6 | 1 644 181,3 | 69 619,5 | 1 245 834,8 |
| Arts, entertainment and recreation | 928 891,5 | 492 459,5 | 16 846,1 | 419 585,9 |
| Other service activities | 2 338 955,0 | 517 172,7 | 18 164,3 | 1 803 618,0 |
| Activities of households as employers; undifferentiated godds and services-producing activities of households for own use | 62 741,0 | 33 102,4 | 188,7 | 29 449,9 |
| Total by type of economic activity | 96 367 515,5 | 31 556 468,9 | 1 504 811,8 | 63 306 234,8 |
| Other taxes on production | 7 779 408,5 | - | - | - |
| Gross domestic product | 103 765 518,2 | |||
| Gross value added | Including | |||
|---|---|---|---|---|
| compensation of employees | other taxes on production | gross operating surplus/gross mixed income | ||
| Production of goods | 100,0 | 27,4 | 1,5 | 71,1 |
| Agriculture, forestry and fishing | 100,0 | 22,8 | 0,3 | 76,9 |
| Industry | 100,0 | 25,6 | 1,7 | 72,7 |
| Mining and quarrying | 100,0 | 21,9 | 1,9 | 76,2 |
| Manufacturing | 100,0 | 27,2 | 1,2 | 71,6 |
| Electricity, gas, steam and air conditioning supply | 100,0 | 43,2 | 4,2 | 52,6 |
| Water supply; sewerage, waste management and remediation activities | 100,0 | 55,7 | 5,3 | 39,0 |
| Construction | 100,0 | 42,5 | 1,5 | 56,0 |
| Production of services | 100,0 | 36,8 | 1,6 | 61,6 |
| Wholesale and retail trade; repair of motor vehicles and motorcycles | 100,0 | 34,7 | 0,6 | 64,7 |
| Transportation and storage | 100,0 | 30,4 | 2,3 | 67,3 |
| Accommodation and food service activities | 100,0 | 39,5 | 1,3 | 59,2 |
| Information and communication | 100,0 | 38,5 | 5,9 | 55,6 |
| Financial and insurance activities | 100,0 | 36,9 | 1,7 | 61,4 |
| Real estate activities | 100,0 | 6,1 | 0,6 | 93,3 |
| Professional, scientific and technical activities | 100,0 | 39,2 | 1,9 | 58,9 |
| Administrative and support service activities | 100,0 | 51,0 | 2,2 | 46,8 |
| Public administration and defence; compulsory social | 100,0 | 76,6 | 3,1 | 20,3 |
| Education | 100,0 | 65,9 | 2,8 | 31,3 |
| Human health and social work activities | 100,0 | 55,6 | 2,4 | 42,0 |
| Arts, entertainment and recreation | 100,0 | 53,0 | 1,8 | 45,2 |
| Other service activities | 100,0 | 22,1 | 0,8 | 77,1 |
| Activities of households as employers; undifferentiated godds and services-producing activities of households for own use | 100,0 | 52,8 | 0,3 | 46,9 |
| Total by type of economic activity | 100,0 | 32,7 | 1,6 | 65,7 |
Gross domestic product (GDP) is one of the most important indicators of the system of national accounts, characterizing the final result of the country's economic activity.
Gross value added is the value of gross output minus the value of intermediate consumption, which serves as an indicator of the contribution to GDP made by individual producers, industries or sectors of the economy.
Compensation of employees - the sum of all remuneration in cash and / or in kind, paid by employers to employees for the work performed during the reporting period.
Taxes on products include taxes, the amount of which directly depends on the cost of goods produced and services rendered.
Other taxes on production consist of all taxes levied on producing units in connection with their production or the use of factors of production, excluding taxes on products. The amount of such taxes does not directly depend on the volume and profitability of production.
Consumption of fixed capital represents a decrease in the value of fixed capital during the reporting period as a result of its physical and moral wear and tear and accidental damage.
The gross (net) profit operating surplus of the economy is that part of the value added that remains with producers after deducting the costs associated with paying workers and paying taxes on production. The term "gross" or "net" in this case indicates whether this indicator includes or does not include the consumption of fixed capital in the production process.
Gross domestic product, derived from the income method determines its structure on the basis of primary incomes: wages of employees, net taxes on production and imports, profits and mixed income.


