Bureau of National Statistics
of the Agency for Strategic Planning and Reforms of the Republic of Kazakhstan
In the structure of wages by type of economic activity, the largest shares are Wholesale and retail trade; repair of motor vehicles and motorcycles (16,14%), Education (12,43%) , Manufacturing (10,90%).
The smallest shares in the wage structure were the activities of households employing domestic workers; activities of households in the production of goods and services for their own consumption (0,12%), Water supply; collection, treatment and disposal of waste, clean-up activities (0,46 % ) and Accommodation and food service activities (1,04%).
| At current prices, million tenge | As a percentage of the total | |
|---|---|---|
| Gross domestic product | 75 546 820,3 | 100,0 |
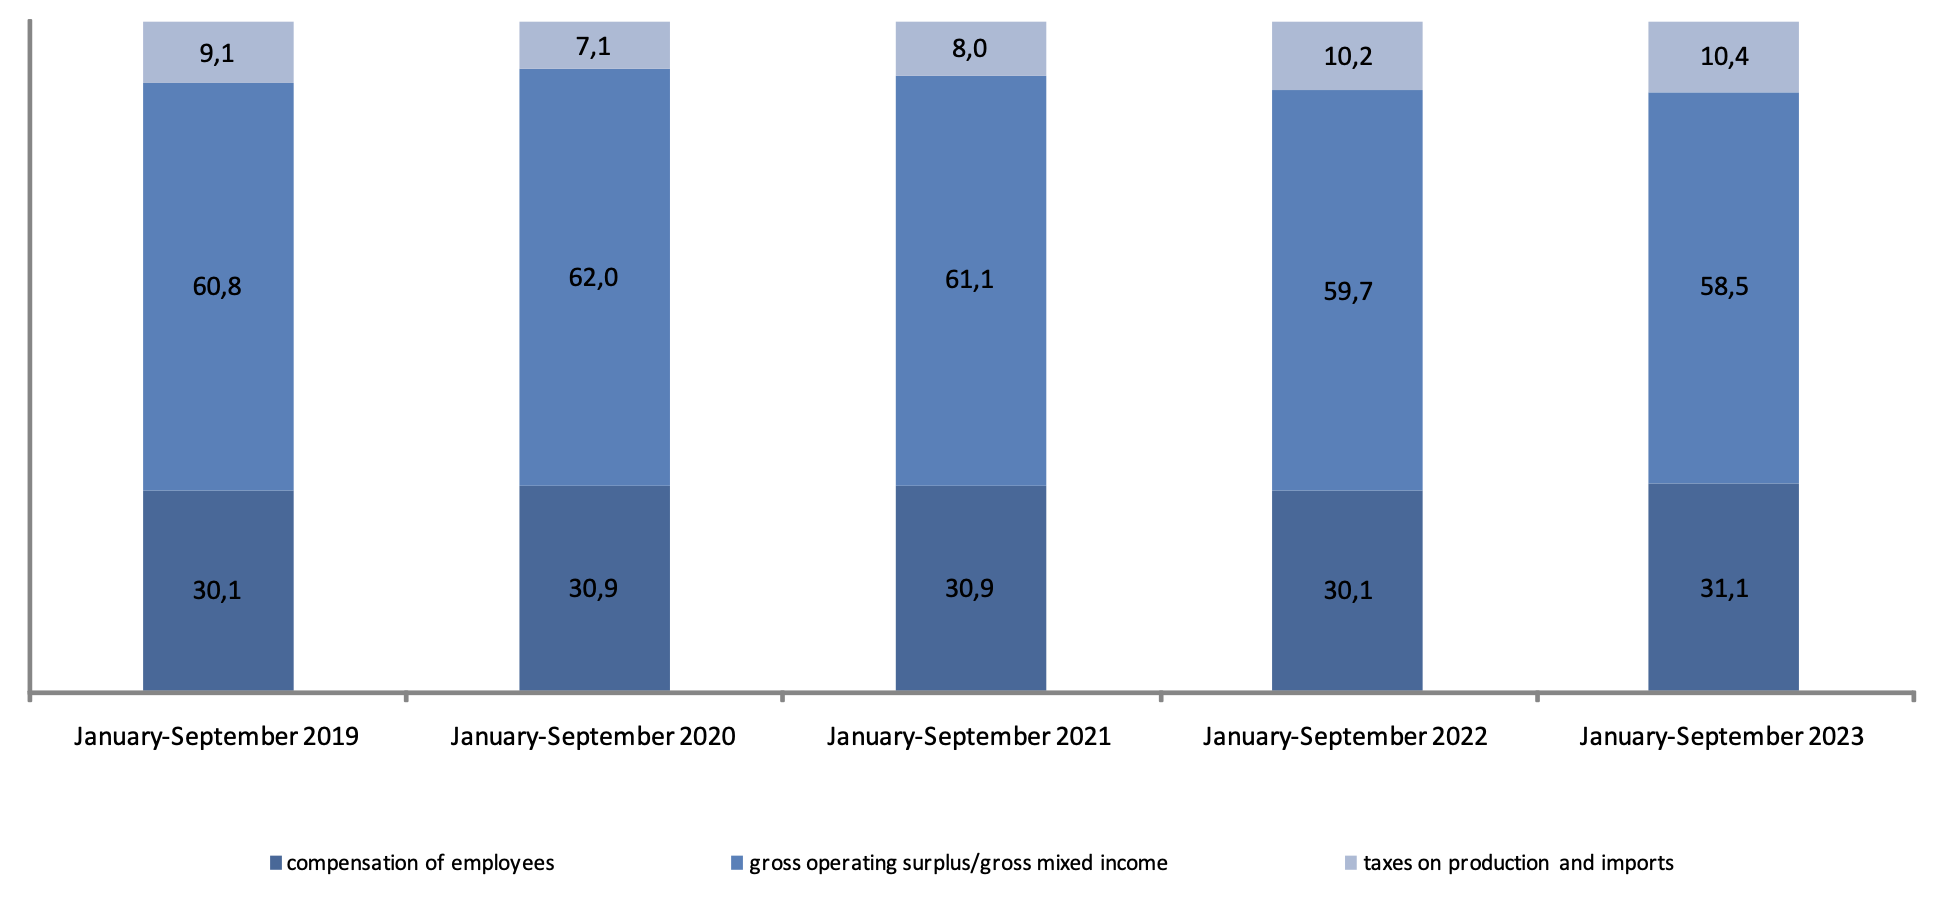
| Compensation of employees | 23 530 951,5 | 31,1 |
| Taxes on production and imports | 7 857 490,2 | 10,4 |
| including: | ||
| product taxes | 6 521 152,4 | 8,6 |
| other taxes on production | 1 336 337,8 | 1,8 |
| Gross operating surplus/gross mixed income | 44 158 378,6 | 58,5 |
| consumption of fixed capital (-) | 7 128 370,0 | 9,4 |
| net income/net mixed income | 37 030 008,6 | 49,1 |
* The balance method is used to calculate GDP by source of income.
| Gross value added | Including | |||
|---|---|---|---|---|
| compensation of employees | other taxes on production | gross operating surplus/gross mixed income | ||
| Production of goods | 28 115 622,4 | 7 524 447,0 | 576 209,6 | 20 014 965,8 |
| Agriculture, forestry and fishing | 3 096 720,2 | 738 032,8 | 12 165,7 | 2 346 521,7 |
| Industry | 20 996 534,9 | 5 213 572,8 | 491 511,4 | 15 291 450,7 |
| Mining and quarrying | 10 222 736,0 | 2 109 417,6 | 256 020,4 | 7 857 298,0 |
| Manufacturing | 9 445 182,7 | 2 565 979,2 | 167 401,4 | 6 711 802,1 |
| Electricity, gas, steam and air conditioning supply | 1 126 172,6 | 429 955,0 | 56 991,9 | 639 225,7 |
| Water supply; sewerage, waste management and remediation activities | 202 443,6 | 108 221,0 | 11 097,7 | 83 124,9 |
| Construction | 4 022 367,3 | 1 572 841,4 | 72 532,5 | 2 376 993,4 |
| Production of services | 40 910 045,5 | 16 006 504,5 | 760 128,2 | 24 143 412,8 |
| Wholesale and retail trade; repair of motor vehicles and motorcycles | 11 906 846,5 | 3 797 873,3 | 101 254,0 | 8 007 719,2 |
| Transportation and storage | 4 137 576,2 | 1 653 906,1 | 129 606,3 | 2 354 063,8 |
| Accommodation and food service activities | 577 627,4 | 244 458,8 | 13 721,8 | 319 446,8 |
| Information and communication | 1 507 394,6 | 719 873,1 | 35 998,4 | 751 523,1 |
| Financial and insurance activities | 2 837 540,5 | 775 800,1 | 51 067,4 | 2 010 673,0 |
| Real estate activities | 5 902 743,3 | 510 694,5 | 42 819,2 | 5 349 229,6 |
| Professional, scientific and technical activities | 2 524 994,6 | 1 230 200,6 | 60 882,4 | 1 233 911,6 |
| Administrative and support service activities | 1 593 098,0 | 878 152,2 | 47 626,8 | 667 319,0 |
| Public administration and defence; compulsory social | 1 548 658,3 | 1 180 046,3 | 57 757,9 | 310 854,1 |
| Education | 3 590 489,1 | 2 923 871,9 | 119 278,9 | 547 338,3 |
| Human health and social work activities | 1 975 392,1 | 1 256 513,0 | 68 931,6 | 649 947,5 |
| Arts, entertainment and recreation | 565 893,7 | 315 342,2 | 13 199,1 | 237 352,4 |
| Other service activities | 2 188 076,9 | 492 229,9 | 17 984,4 | 1 677 862,6 |
| Activities of households as employers; undifferentiated godds and services-producing activities of households for own use | 53 714,3 | 27 542,5 | 0,0 | 26 171,8 |
| Total by type of economic activity | 69 025 667,9 | 23 530 951,5 | 1 336 337,8 | 44 158 378,6 |
| Other taxes on production | 6 521 152,4 | - | - | - |
| Gross domestic product | 75 546 820,3 | |||
| Gross value added | Including | |||
|---|---|---|---|---|
| compensation of employees | other taxes on production | gross operating surplus/gross mixed income | ||
| Production of goods | 100,0 | 26,8 | 2,0 | 71,2 |
| Agriculture, forestry and fishing | 100,0 | 23,8 | 0,4 | 75,8 |
| Industry | 100,0 | 24,8 | 2,3 | 72,9 |
| Mining and quarrying | 100,0 | 20,6 | 2,5 | 76,9 |
| Manufacturing | 100,0 | 27,2 | 1,8 | 71,0 |
| Electricity, gas, steam and air conditioning supply | 100,0 | 38,2 | 5,1 | 56,7 |
| Water supply; sewerage, waste management and remediation activities | 100,0 | 53,5 | 5,5 | 41,0 |
| Construction | 100,0 | 39,1 | 1,8 | 59,1 |
| Production of services | 100,0 | 39,1 | 1,9 | 59,0 |
| Wholesale and retail trade; repair of motor vehicles and motorcycles | 100,0 | 31,9 | 0,9 | 67,2 |
| Transportation and storage | 100,0 | 40,0 | 3,1 | 56,9 |
| Accommodation and food service activities | 100,0 | 42,3 | 2,4 | 55,3 |
| Information and communication | 100,0 | 47,8 | 2,4 | 49,8 |
| Financial and insurance activities | 100,0 | 27,3 | 1,8 | 70,9 |
| Real estate activities | 100,0 | 8,7 | 0,7 | 90,6 |
| Professional, scientific and technical activities | 100,0 | 48,7 | 2,4 | 48,9 |
| Administrative and support service activities | 100,0 | 55,1 | 3,0 | 41,9 |
| Public administration and defence; compulsory social | 100,0 | 76,2 | 3,7 | 20,1 |
| Education | 100,0 | 81,4 | 3,3 | 15,3 |
| Human health and social work activities | 100,0 | 63,6 | 3,5 | 32,9 |
| Arts, entertainment and recreation | 100,0 | 55,7 | 2,3 | 42,0 |
| Other service activities | 100,0 | 22,5 | 0,8 | 76,7 |
| Activities of households as employers; undifferentiated godds and services-producing activities of households for own use | 100,0 | 51,3 | 0,0 | 48,7 |
| Total by type of economic activity | 100,0 | 34,1 | 1,9 | 64,0 |
Gross domestic product (GDP) is one of the most important indicators of the system of national accounts, characterizing the final result of the country's economic activity.
Gross value added is the value of gross output minus the value of intermediate consumption, which serves as an indicator of the contribution to GDP made by individual producers, industries or sectors of the economy.
Compensation of employees - the sum of all remuneration in cash and / or in kind, paid by employers to employees for the work performed during the reporting period.
Taxes on products include taxes, the amount of which directly depends on the cost of goods produced and services rendered.
Other taxes on production consist of all taxes levied on producing units in connection with their production or the use of factors of production, excluding taxes on products. The amount of such taxes does not directly depend on the volume and profitability of production.
Consumption of fixed capital represents a decrease in the value of fixed capital during the reporting period as a result of its physical and moral wear and tear and accidental damage.
The gross (net) profit operating surplus of the economy is that part of the value added that remains with producers after deducting the costs associated with paying workers and paying taxes on production. The term "gross" or "net" in this case indicates whether this indicator includes or does not include the consumption of fixed capital in the production process.
Gross domestic product, derived from the income method determines its structure on the basis of primary incomes: wages of employees, net taxes on production and imports, profits and mixed income.


