Bureau of National Statistics
of the Agency for Strategic Planning and Reforms of the Republic of Kazakhstan
Regionally, in January-July 2023, an increase in cargo turnover was noted in the cities of Shymkent (39.9%), Almaty (32%), Astana (22.1%) and East Kazakhstan (37.2%), Pavlodar (27.1%), West Kazakhstan (16.9%), North Kazakhstan (15.6%), Kyzylorda (6.9%), Karaganda (6.2%), Kostanay (1.5%) and Aktobe (1.2%) regions.
Passenger turnover increased in the following cities: Almaty (32.7%), Astana (19.7%), Shymkent (1.9%) and Atyrau (38.4%), Turkestan (26.8%), North Kazakhstan (26.1%), East Kazakhstan (25.8%), Almaty (18.9%), Mangystau (10.9%), Kyzylorda (10%), Aktobe (5.9%) regions.
| Cargo turnover | Passenger turnover | |
| Republic of Kazakhstan | 102,4 | 113,0 |
| Abay | 86,3 | 85,4 |
| Akmola | 80,9 | 80,5 |
| Aktobe | 100,2 | 105,9 |
| Almaty | 97,3 | 118,9 |
| Atyrau | 94,0 | 138,4 |
| Batys Kazakhstan | 116,9 | 87,7 |
| Zhambyl | 95,7 | 94,1 |
| Zhetisu | 89,9 | 92,7 |
| Karaganda | 106,2 | 96,0 |
| Kostanai | 101,5 | 99,3 |
| Kyzylorda | 106,9 | 110,0 |
| Mangystau | 94,8 | 110,9 |
| Pavlodar | 127,1 | 99,8 |
| Soltustik Kazakhstan | 115,6 | 126,1 |
| Turkistan | 93,5 | 126,8 |
| Ulytau | 100,8 | 96,5 |
| Shygys Kazakhstan | 137,2 | 125,8 |
| Astana city | 122,1 | 119,7 |
| Almaty city | 132,0 | 132,7 |
| Shymkent city | 139,9 | 101,9 |
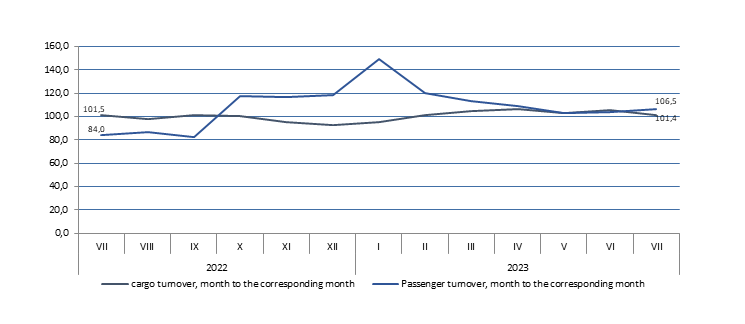
In January-July 2023, 237.4 million tons of cargo were transported by rail in the republic, which is 0.8% less than the level of January-July 2022, cargo turnover during this period amounted to 189.7 billion. t-km (increased by 5.1% compared to January-July 2022), 11.6 million passengers were transported (4.3% more than in January-July 2022), passenger turnover amounted to 9.4 billion p-km (increased by 0.9% compared to January-July 2022).
In January-July 2023, compared to the same period last year, there was an increase in the transportation of goods by road transport by 12.3%. Passenger transportation and passenger transportation also increased by 9.1% and 2.2%, respectively.
In January-July 2023, 160.6 million tons of cargo were transported (1.9% less than in January-July 2022), cargo turnover amounted to 84.6 billion tons. t-km (decreased by 2.1% compared to January-July 2022).
In January-July 2023, 7315.1 thousand passengers were transported by air transport of the republic (increased by 26.1% compared to January-July 2022), passenger turnover amounted to 14478.8 million p-km (increased by 41.5% compared to January-July 2022).
In January-July 2023, 377.6 thousand tons of cargo were transported by inland waterway (decreased by 5% compared to January-July 2022), 90.2 thousand passengers were transported (decreased by 9.6% compared to January-July 2022).
In January-July 2023, 798.6 thousand tons of cargo were transported by sea, there is an increase in cargo transportation by 19.5% compared to January-July 2022, cargo turnover amounted to 467.2 million tons-km and increased by 2.8% compared to January-July 2022.
*Statistical data on the transport industry since January 2023 have been formed taking into account changes in the methodological approach to the formation of indicators of the activities of individual entrepreneurs engaged in commercial transportation of goods and passengers by road transport. In order to obtain comparable data with the same period last year, the main indicators of the Transport industry for 2022 have been reformed.
Transported cargo – the amount of cargo in tons transported by transport.
Cargo turnover of transport – the volume of work of transport for the transportation of goods, expressed in ton-kilometers. It is defined as the sum of the products of the weight of each batch (shipment) of the transported cargo over the distance of its transportation.
Transported passengers – the number of passengers transported over a certain period of time. The unit of observation in passenger transportation statistics is a passenger-trip.
Passenger turnover of transport – the volume of work of transport for the transportation of passengers. The unit of measurement is the passenger-kilometer, i.e. the movement of 1 passenger over a distance of 1 kilometer. It is determined by summing the products of the number of passengers of each carriage by the distance of carriage in kilometers.
The physical volume index – is a relative indicator that characterizes the change in the quantitative volumes of freight and passenger traffic in the reporting period compared to the base period and is calculated on the basis of the weighted average growth rate of revenue from the transportation of goods and passengers.
The release provides statistical data on the work of enterprises with the main type of activity - transport (OKED code 49-51), reporting on the monthly form 1-transport, enterprises of other sectors of the economy engaged in the transportation of passengers and cargo on a commercial basis, as well as individual entrepreneurs engaged in the transportation of goods and passengers by road on a commercial basis, reporting according to quarterly forms: 1-sole proprietor (auto cargo), 1-sole proprietor (auto passengers).


