Bureau of National Statistics
of the Agency for Strategic Planning and Reforms of the Republic of Kazakhstan
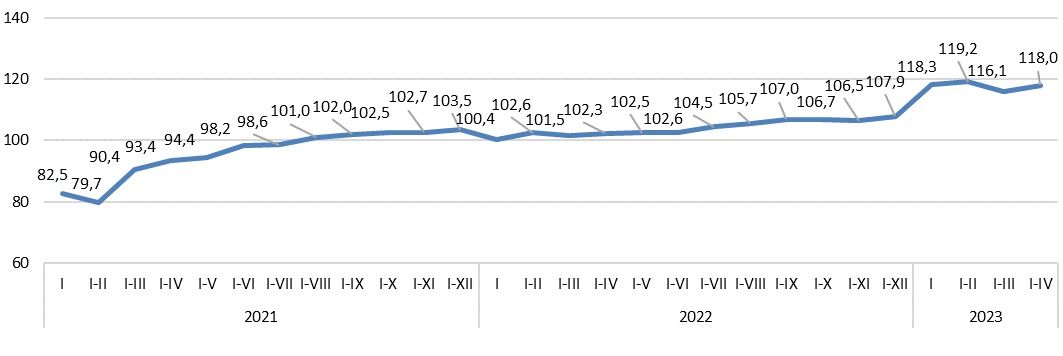
Since August 2021, the volume of investments has been steadily increasing positively in comparison with the cor-responding period last year.
The main share of investments falls on Atyrau region (23.5%).
| April 2023 to | January-April 2023 by January-April 2022 | ||
|---|---|---|---|
| March 2023 | April 2022 | ||
| Republic of Kazakhstan | 95,6 | 123,0 | 118,0 |
| Abay | 42,3 | 101,9 | 112,9 |
| Akmola | 96,7 | 104,1 | 119,0 |
| Aktobe | 79,2 | 143,5 | 111,4 |
| Almaty | 111,6 | 134,3 | 124,8 |
| Atyrau | 119,6 | 119,3 | 112,1 |
| Batys Kazakhstan | 117,5 | 157,7 | 134,6 |
| Zhambyl | 57,1 | 125,4 | 107,4 |
| Zhetisu | 166,9 | 112,2 | 120,9 |
| Karaganda | 69,6 | 106,9 | 124,9 |
| Kostanai | 108,8 | 164,2 | 127,3 |
| Kyzylorda | 56,7 | 112,0 | 142,1 |
| Mangystau | 108,2 | 204,7 | 146,0 |
| Pavlodar | 57,9 | 106,5 | 125,8 |
| Soltustik Kazakhstan | 60,4 | 133,8 | 120,0 |
| Turkistan | 79,8 | 160,5 | 160,4 |
| Ulytau | 100,0 | 102,9 | 124,3 |
| Shygys Kazakhstan | 50,2 | 106,4 | 109,6 |
| Astana city | 110,5 | 97,1 | 117,2 |
| Almaty city | 120,0 | 109,4 | 100,4 |
| Shymkent city | 149,7 | 142,8 | 120,1 |
About half of the national volume of capital investments is carried out by large and medium-sized enterprises.
| Mastered investments in fixed capital | Including | |||
|---|---|---|---|---|
| small businesses | medium -sized enterprises | large enterprises | ||
| January-April 2021 | 2 868 366 796 | 1 301 721 925 | 263 908 861 | 1 302 736 010 |
| January-April 2022 | 3 104 577 316 | 1 517 127 574 | 163 650 624 | 1 423 799 118 |
| January-April 2023 | 3 816 788 356 | 1 801 800 223 | 233 517 713 | 1 781 470 420 |
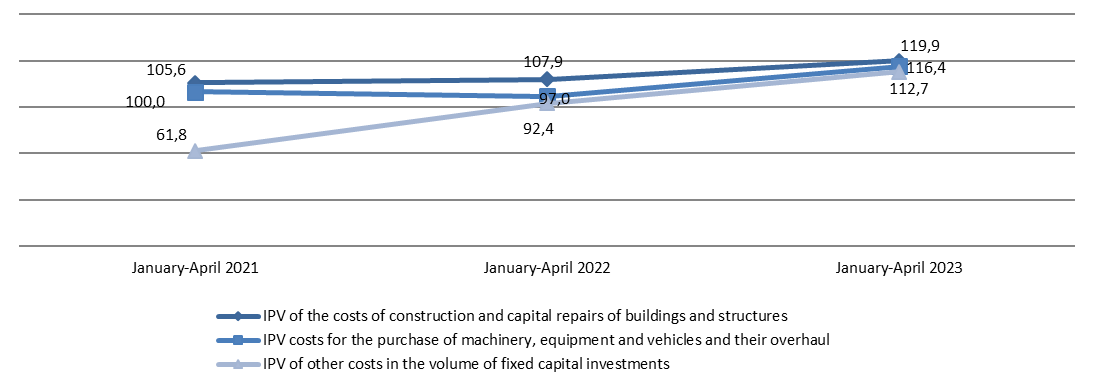
Almost 58% of the total costs are for construction and major repairs of buildings and structures, more than a quar-ter of the total amount is for the purchase of machinery, equipment and vehicles.
The predominant sources of investment financing remain the own funds of economic entities, the volume of which in January-April 2023 amounted to 3065.3 billion tenge or 80.3% of the total.
Budget funds accounted for 11.1% of the total investment in fixed capital, while compared with January-April 2022 increased by 41.1%.
For the banking sector, the financing of the real sector of the economy in the total volume of investments in fixed capital takes 1.7%.
| January-April 2023 | For reference: as a percentage of the total | |||
|---|---|---|---|---|
| thousand tenge | as a percentage of the total | January-April 2022 | January-April 2021 | |
| Investments in fixed capital | 3 816 788 356 | 100,0 | 100,0 | 100,0 |
| including at the expense of funds: | ||||
| state budget | 422 113 766 | 11,1 | 9,2 | 9,1 |
| own funds | 3 065 291 629 | 80,3 | 80,5 | 76,8 |
| bank loans | 65 338 347 | 1,7 | 3,1 | 2,8 |
| of them: | ||||
| loans from foreign banks | - | - | 0,4 | 1,1 |
| other borrowed funds | 264 044 614 | 6,9 | 7,2 | 11,3 |
| of them: | ||||
| borrowed funds of non-residents | 75 267 213 | 2.0 | 1,3 | 1,3 |
A significant share of investments in fixed capital in January-April 2023 accounted for industry (51.8%), mining and quarrying (37%), operations with real estate (20.9%) and transport and warehousing (8.9%).
| Investments in fixed capital, thousand tenge | in % by January-April 2022 | Share in the total volume of investments, as a percentage | |
|---|---|---|---|
| Total | 3 816 788 356 | 118,0 | 100,0 |
| Including: | |||
| Agriculture, forestry and fisheries | 196 534 149 | 126,5 | 5,1 |
| Industry | 1 977 284 279 | 118,1 | 51,8 |
| Including: | |||
| Mining and quarrying | 1 412 215 128 | 117,3 | 37,0 |
| Manufacturing industry | 324 987 668 | 107,0 | 8,5 |
| Supply of electricity, gas, steam, hot water and air conditioning | 149 491 521 | 142,6 | 3,9 |
| Water supply; collection, treatment and disposal of waste, activities for the elimination of pollution | 90 589 962 | 160,5 | 2,4 |
| Construction | 29 154 846 | 63,4 | 0,8 |
| Wholesale and retail trade; car and motorcycle repair | 102 874 999 | 148,5 | 2,7 |
| Transport and warehousing | 338 491 241 | 139,3 | 8,9 |
| Provision of accommodation and food services | 35 512 916 | 205,1 | 0,9 |
| Information and communication | 30 323 873 | 115,8 | 0,8 |
| Financial and insurance activities | 27 352 255 | 93,2 | 0,7 |
| Operations with real estate | 797 485 900 | 110,0 | 20,9 |
| Professional, scientific and technical activities | 29 157 777 | 175,8 | 0,8 |
| Administrative and support services activities | 27 402 753 | 149,3 | 0,7 |
| Public administration and defense; compulsory social security | 33 339 484 | 197,3 | 0,9 |
| Education | 76 342 277 | 130,8 | 2,0 |
| Healthcare and social services for the population | 73 053 040 | 159,7 | 1,9 |
| Arts, entertainment and recreation | 36 191 942 | 98,3 | 0,9 |
| Provision of other types of services | 6 286 643 | 43,2 | 0,2 |
Investments in fixed capital - investments in order for investors to obtain an economic, social or environmental effect in the case of new construction, expansion, as well as reconstruction and modernization of facilities that lead to an increase in the initial cost of the facility, as well as for the purchase of machinery, equipment, vehicles, for the formation of the main herd, perennial plantings, etc.
The costs of construction and installation works and capital repairs include the costs of a complex of works on the construction of buildings and structures, expansion, reconstruction, installation of energy, technological and other equipment, as well as the costs of capital repairs of non-residential, residential buildings and structures.
The cost of purchasing machinery and equipment - an element of the technological structure of investments, including the cost of purchasing machinery, vehicles, equipment.
Other costs in the volume of investments in fixed capital – the costs of design and survey work, supervision, maintenance of directorates of objects under construction, the costs of cultivated biological costs, as well as the costs of objects created or acquired by organizations used in economic activity for more than one year, having a monetary valuation, having the ability to alienate and generating income, but which are not material values.
The index of the physical volume of investments in fixed capital characterizes the change in investment investments in dynamics, is determined by the ratio of the volume of investments in fixed capital in the reporting and compared period at comparable prices
Statistical information on investments in fixed capital is formed on the basis of primary statistical data of national statistical observations of economic entities engaged in investment activities (regardless of the number of employees and type of economic activity) and national statistical observations on the commissioning of facilities by individual developers.
Accounting of investment investments is provided at the place of actual implementation, regardless of the place of registration of the economic entity engaged in investment activities.
Operational data on investments in fixed capital, formed on a monthly basis, are updated with annual data.
By types of economic activity, data on investments in fixed capital are formed according to the direction of use (depends on the nature of the direction of investment (end use) and by the type of economic activity of the investor.
More detailed methodological explanations are available at the following link:
Methodology for the formation of indicators of investment activity statistics


