Bureau of National Statistics
of the Agency for Strategic Planning and Reforms of the Republic of Kazakhstan
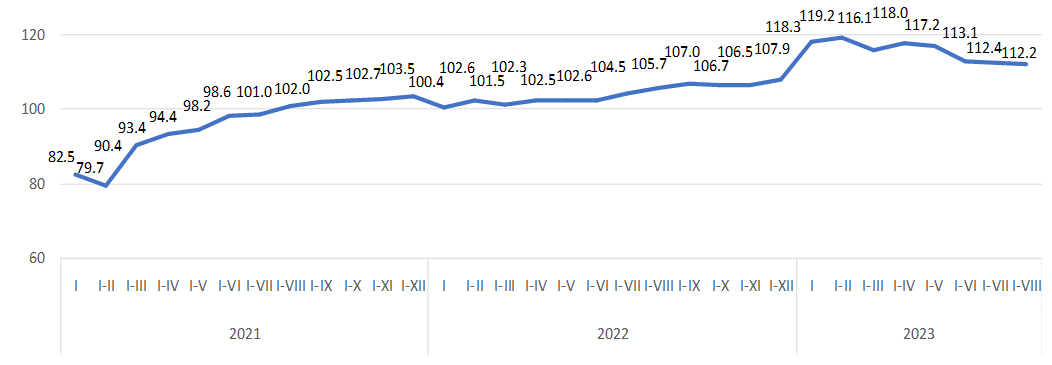
Since August 2021, the volume of investments has been steadily increasing positively in comparison with the corre-sponding period last year.
The significant share of investments falls on Atyrau region (19.1%).
| August 2023 to | January-August 2023 by January-August 2022 | ||
|---|---|---|---|
| July 2023 | August 2022 | ||
| Republic of Kazakhstan | 111.4 | 110.9 | 112.2 |
| Abai | 108.7 | 100.2 | 145.0 |
| Akmola | 259.5 | 223.1 | 127.6 |
| Aktobe | 86.0 | 101.5 | 107.1 |
| Almaty | 135.7 | 122.7 | 117.6 |
| Atyrau | 99.1 | 74.3 | 96.1 |
| Batys Kazakhstan | 100.7 | 92.7 | 123.8 |
| Zhambyl | 112.9 | 67.2 | 108.0 |
| Zhetisu | 150.6 | 177.8 | 111.7 |
| Karagandy | 67.7 | 106.5 | 116.9 |
| Kostanai | 108.0 | 97.9 | 112.0 |
| Kyzylorda | 143.4 | 138.2 | 127.0 |
| Mangystau | 142.0 | 197.4 | 153.5 |
| Pavlodar | 173.7 | 164.8 | 131.3 |
| Soltustik Kazakhstan | 156.5 | 148.8 | 107.6 |
| Turkistan | 106.3 | 219.0 | 133.7 |
| Ulytau | 96.3 | 113.5 | 105.9 |
| Shygys Kazakhstan | 89.3 | 81.1 | 106.3 |
| Astana city | 80.1 | 75.6 | 103.3 |
| Almaty city | 84.9 | 92.3 | 100.1 |
| Shymkent city | 139.0 | 137.5 | 126.5 |
About half of the national volume of capital investments is carried out by large and medium-sized enterprises.
| Mastered investments in fixed capital | Including | |||
|---|---|---|---|---|
| small businesses | medium -sized enterprises | large enterprises | ||
| January-August 2021 | 7 329 509 498 | 3 768 193 065 | 658 780 487 | 2 902 535 946 |
| January-August 2022 | 8 182 566 501 | 4 285 942 731 | 413 681 476 | 3 482 942 294 |
| January-August 2023 | 9 649 662 871 | 5 022 705 759 | 633 489 483 | 3 993 467 629 |
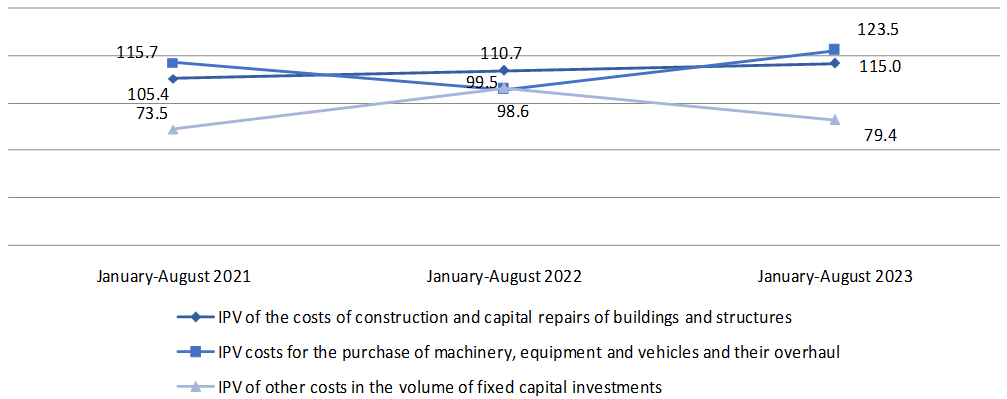
Almost 60% of the total costs are for construction and major repairs of buildings and structures, more than a quarter of the total amount is for the purchase of machinery, equipment and vehicles.
The predominant sources of investment financing remain the own funds of economic entities, the volume of which in January-August 2023 amounted to 7328.6 billion tenge or 75.9% of the total.
Budget funds accounted for 14.5% of the total investment in fixed capital, while compared with January-August 2022 increased by 21.9%.
For the banking sector, the financing of the real sector of the economy in the total volume of investments in fixed capi-tal takes 2.4%.
| January-August 2023 | For reference: as a percentage of the total | |||
|---|---|---|---|---|
| thousand tenge | as a percentage of the total | January-August 2022 | January-August 2021 | |
| Investments in fixed capital | 9 649 662 871 | 100.0 | 100.0 | 100.0 |
| including at the expense of funds: | ||||
| state budget | 1 395 852 569 | 14.5 | 13.3 | 13.2 |
| Ownfunds | 7 328 557 105 | 75.9 | 75.4 | 72.1 |
| Bankloans | 227 407 939 | 2.4 | 2.8 | 2.5 |
| of them: | ||||
| loans from foreign banks | 2 768 310 | 0.0 | 0.3 | 0.8 |
| other borrowed funds | 697 845 258 | 7.2 | 8.5 | 12.2 |
| of them: | ||||
| borrowed funds of non-residents | 240 856 851 | 2.5 | 1.4 | 2.1 |
A main share of investments in fixed capital in January-August 2023 accounted for industry (48.9%) (including mining and quarrying - 31.3%, manufacturing industry - 8.4%), operations with real estate (18.7%), transport and warehousing (12.4%) and agriculture, forestry and fisheries (5.9%).
| Investments in fixed capital, thousand tenge | in % by January-August 2022 | Share in the total volume of investments, as a percentage | |
|---|---|---|---|
| Total | 9 649 662 871 | 112.2 | 100.0 |
| Including: | |||
| Agriculture, forestry and fisheries | 564 505 332 | 120.7 | 5.9 |
| Industry | 4 716 307 260 | 108.5 | 48.9 |
| Including: | |||
| Mining and quarrying | 3 024 617 227 | 105.7 | 31.3 |
| Manufacturing industry | 809 789 861 | 91.4 | 8.4 |
| Supply of electricity, gas, steam, hot water and air conditioning | 595 202 744 | 164.6 | 6.2 |
| Water supply; collection, treatment and disposal of waste, activities for the elimination of pollution | 286 697 422 | 127.2 | 3.0 |
| Construction | 116 305 671 | 98.5 | 1.2 |
| Wholesale and retail trade; car and motorcycle repair | 225 147 678 | 130.1 | 2.3 |
| Transport and warehousing | 1 200 164 528 | 149.0 | 12.4 |
| Provision of accommodation and food services | 71 679 520 | 109.8 | 0.7 |
| Information and communication | 99 753 477 | 145.1 | 1.0 |
| Financial and insurance activities | 66 993 416 | 86.6 | 0.7 |
| Operations with real estate | 1 803 866 122 | 99.9 | 18.7 |
| Professional, scientific and technical activities | 50 703 185 | 165.8 | 0.5 |
| Administrative and support services activities | 99 588 671 | 121.5 | 1.0 |
| Public administration and defense; compulsory social security | 80 401 113 | 131.4 | 0.8 |
| Education | 245 249 982 | 131.9 | 2.5 |
| Healthcare and social services for the population | 168 209 027 | 153.1 | 1.7 |
| Arts, entertainment and recreation | 116 504 748 | 117.8 | 1.2 |
| Provision of other types of services | 24 283 144 | 41.9 | 0.3 |
Investments in fixed capital - investments in order for investors to obtain an economic, social or environmental ef-fect in the case of new construction, as well as expansion, reconstruction and modernization of facilities (which lead to an increase in the initial cost of the facility), the purchase of machinery, equipment, vehicles, for the formation of the main herd, perennial plantings, etc.
The costs of construction and installation works and capital repairs include the costs of a complex of works on the construction of buildings and structures, expansion, reconstruction, installation of energy, technological and other equip-ment, as well as the costs of capital repairs of non-residential, residential buildings and structures.
The cost of purchasing machinery and equipment - an element of the technological structure of investments, in-cluding the cost of purchasing machinery, vehicles, equipment.
Other costs in the volume of investments in fixed capital – the costs of design and survey work, supervision, maintenance of directorates of objects under construction, the costs of cultivated biological costs, as well as the costs of objects created or acquired by organizations used in economic activity for more than one year, having a monetary valua-tion, having the ability to alienate and generating income, but which are not material values.
The index of the physical volume of investments in fixed capital characterizes the change in investment invest-ments in dynamics, is determined by the ratio of the volume of investments in fixed capital in the reporting and compared period at comparable prices
Statistical information on investments in fixed capital is formed on the basis of primary statistical data of national statistical observations of economic entities engaged in investment activities (regardless of the number of employees and type of economic activity) and national statistical observations on the commissioning of facilities by individual developers.
Accounting of investment investments is provided at the place of actual implementation, regardless of the place of registration of the economic entity engaged in investment activities.
Operational data on investments in fixed capital, formed on a monthly basis, are updated with annual data.
By types of economic activity, data on investments in fixed capital are formed according to the direction of use (depends on the nature of the direction of investment (end use) and by the type of economic activity of the investor.
More detailed methodological explanations are available at the following link:
Methodology for the formation of indicators of investment activity statisticsStatistical compilation "Investment and construction activities in the Republic of Kazakhstan"


