Bureau of National Statistics
of the Agency for Strategic Planning and Reforms of the Republic of Kazakhstan
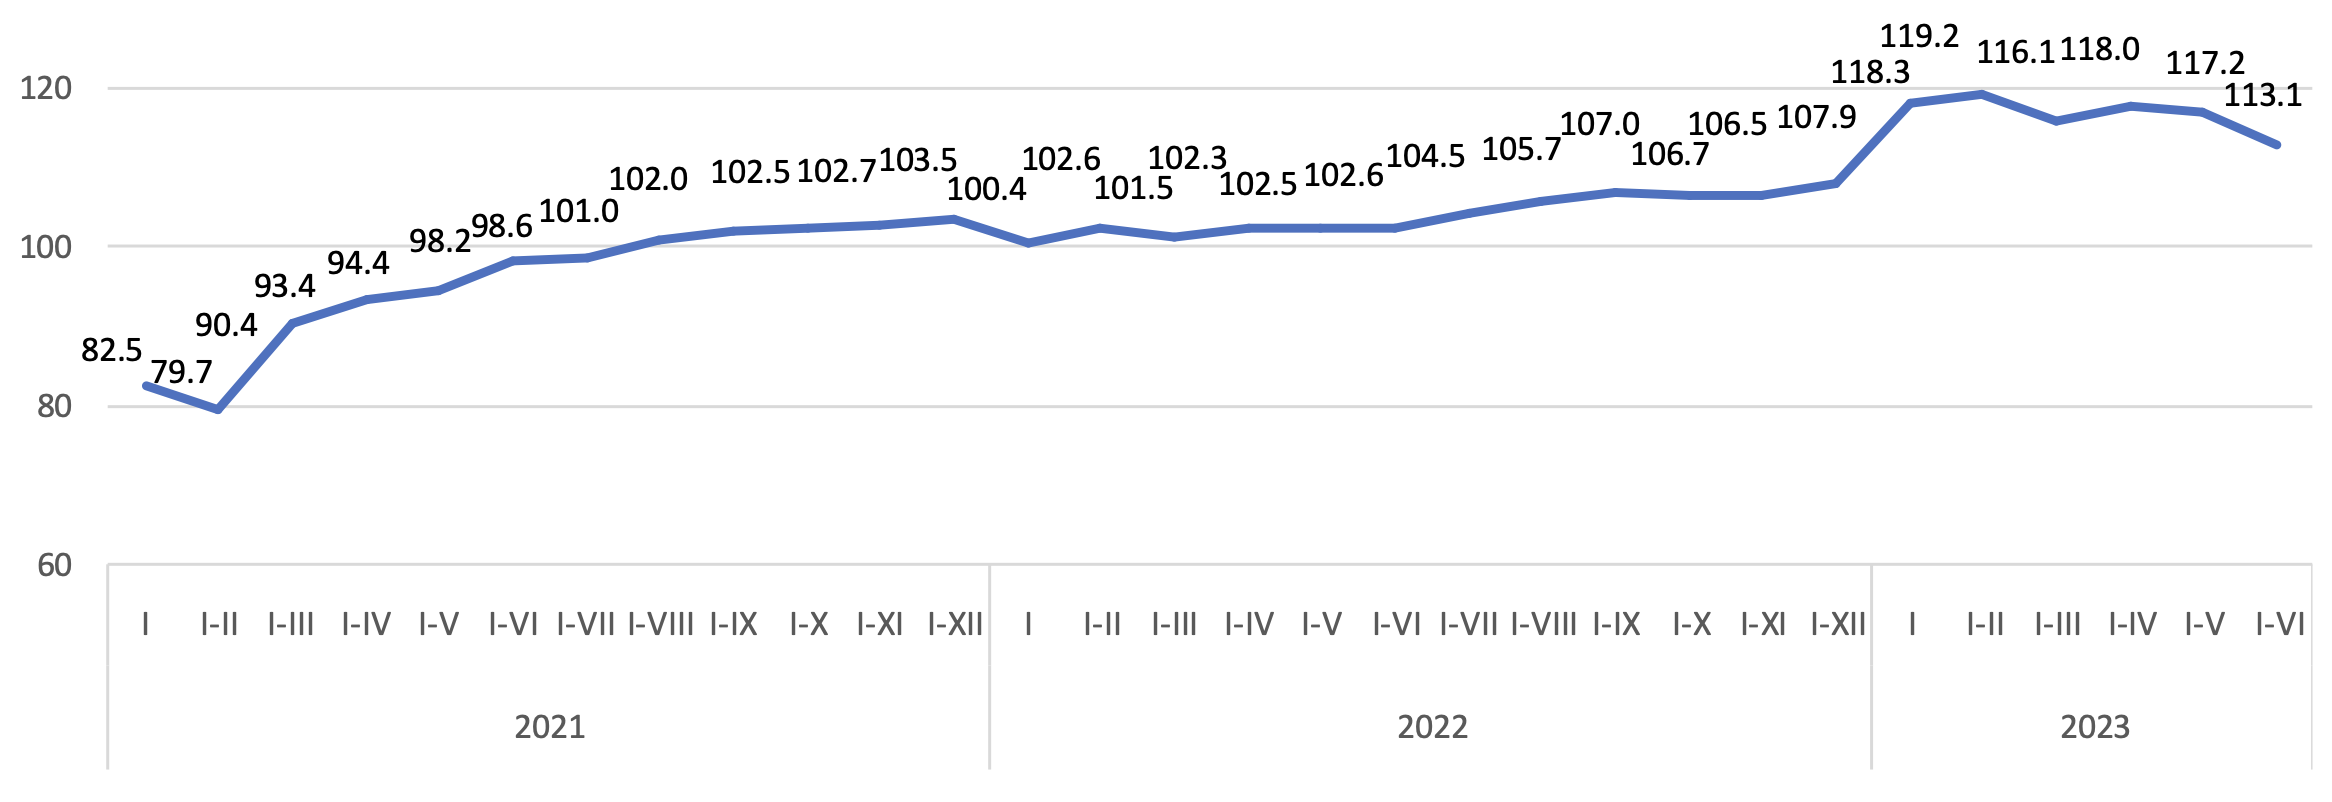
Since August 2021, the volume of investments has been steadily increasing positively in comparison with the corre-sponding period last year.
The significant share of investments falls on Atyrau region (20.6%).
| June 2023 to | January-June 2023 by January-June 2022 | ||
|---|---|---|---|
| May 2023 | June 2022 | ||
| Republic of Kazakhstan | 130.3 | 101.8 | 113.1 |
| Abai | 266.9 | 241.6 | 154.2 |
| Akmola | 138.5 | 111.0 | 116.1 |
| Aktobe | 125.0 | 89.4 | 103.0 |
| Almaty | 152.0 | 135.0 | 119.4 |
| Atyrau | 100.4 | 95.0 | 104.5 |
| Batys Kazakhstan | 111.6 | 121.6 | 130.7 |
| Zhambyl | 290.7 | 160.0 | 132.7 |
| Zhetisu | 122.7 | 78.1 | 101.3 |
| Karagandy | 153.0 | 86.2 | 117.1 |
| Kostanai | 81.5 | 69.2 | 118.9 |
| Kyzylorda | 186.1 | 89.2 | 123.1 |
| Mangystau | 123.4 | 138.7 | 141.6 |
| Pavlodar | 130.3 | 130.8 | 129.6 |
| Soltustik Kazakhstan | 181.6 | 87.2 | 98.1 |
| Turkistan | 168.9 | 67.6 | 108.8 |
| Ulytau | 104.6 | 52.5 | 99.3 |
| Shygys Kazakhstan | 147.1 | 108.2 | 110.7 |
| Astana city | 90.4 | 76.2 | 107.3 |
| Almaty city | 100.1 | 97.9 | 100.7 |
| Shymkent city | 182.0 | 162.3 | 130.4 |
About half of the national volume of capital investments is carried out by large and medium-sized enterprises.
| Mastered investments in fixed capital | Including | |||
|---|---|---|---|---|
| small businesses | medium -sized enterprises | large enterprises | ||
| January-June 2021 | 5 247 905 943 | 2 665 028 957 | 474 194 584 | 2 108 682 402 |
| January-June 2022 | 5 680 799 555 | 2 973 639 579 | 283 929 521 | 2 423 230 455 |
| January-June 2023 | 6 717 611 905 | 3 419 357 241 | 420 863 676 | 2 877 390 988 |
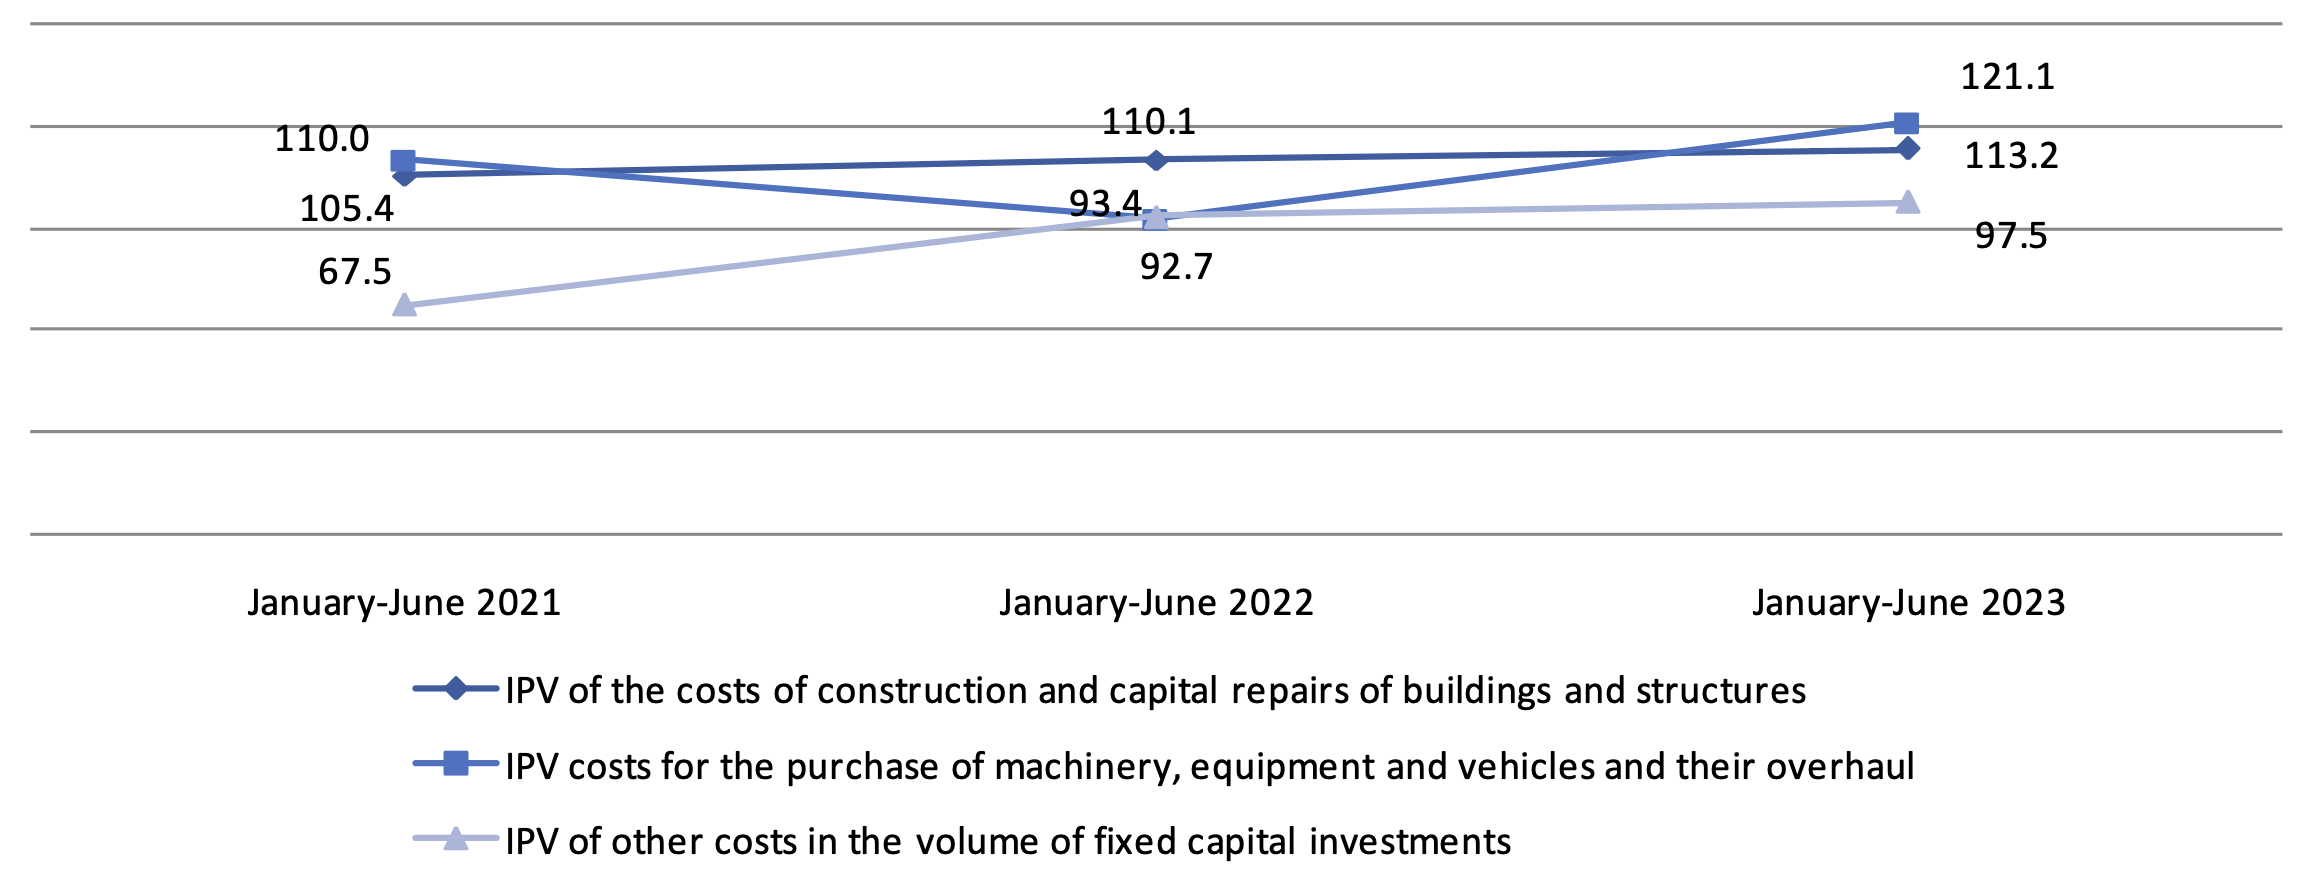
Almost 59% of the total costs are for construction and major repairs of buildings and structures, more than a quarter of the total amount is for the purchase of machinery, equipment and vehicles.
The predominant sources of investment financing remain the own funds of economic entities, the volume of which in Jan-uary-June 2023 amounted to 5165.5 billion tenge or 76.9% of the total.
Budget funds accounted for 13.6% of the total investment in fixed capital, while compared with January-June 2022 in-creased by 34.9%.
For the banking sector, the financing of the real sector of the economy in the total volume of investments in fixed capital takes 2.1%.
| January-June 2023 | For reference: as a percentage of the total | |||
|---|---|---|---|---|
| thousand tenge | as a percentage of the total | January-June 2022 | January-June 2021 | |
| Investments in fixed capital | 6 717 611 905 | 100.0 | 100.0 | 100.0 |
| including at the expense of funds: | ||||
| state budget | 916 784 940 | 13.6 | 11.4 | 12.0 |
| Ownfunds | 5 165 507 250 | 76.9 | 77.6 | 73.3 |
| Bankloans | 141 747 560 | 2.1 | 3.2 | 2.4 |
| of them: | ||||
| loans from foreign banks | 598 594 | 0.0 | 0.4 | 0.7 |
| other borrowed funds | 493 572 155 | 7.4 | 7.8 | 12.3 |
| of them: | ||||
| borrowed funds of non-residents | 167 272 207 | 2.0 | 1.3 | 2.0 |
A main share of investments in fixed capital in January-June 2023 accounted for industry (49.6%) (including mining and quarrying - 32.9%, manufacturing industry - 8.7%), operations with real estate (19.4%), transport and warehousing (11.3%) and agriculture, forestry and fisheries (6.4%).
| Investments in fixed capital, thousand tenge | in % by January-June 2022 | Share in the total volume of investments, as a percentage | |
|---|---|---|---|
| Total | 6 717 611 905 | 113.1 | 100.0 |
| Including: | |||
| Agriculture, forestry and fisheries | 432 735 880 | 122.1 | 6.4 |
| Industry | 3 333 037 034 | 110.9 | 49.6 |
| Including: | |||
| Mining and quarrying | 2 210 169 362 | 111.4 | 32.9 |
| Manufacturing industry | 585 994 360 | 93.5 | 8.7 |
| Supply of electricity, gas, steam, hot water and air conditioning | 342 302 491 | 139.0 | 5.1 |
| Water supply; collection, treatment and disposal of waste, activities for the elimination of pollution | 194 570 823 | 141.2 | 2.9 |
| Construction | 81 765 368 | 98.2 | 1.2 |
| Wholesale and retail trade; car and motorcycle repair | 153 365 184 | 132.2 | 2.3 |
| Transport and warehousing | 761 536 276 | 156.8 | 11.3 |
| Provision of accommodation and food services | 57 487 193 | 117.8 | 0.9 |
| Information and communication | 47 538 767 | 100.0 | 0.7 |
| Financial and insurance activities | 44 939 329 | 79.3 | 0.7 |
| Operations with real estate | 1 305 932 639 | 100.7 | 19.4 |
| Professional, scientific and technical activities | 38 036 731 | 160.4 | 0.6 |
| Administrative and support services activities | 71 019 560 | 163.2 | 1.1 |
| Public administration and defense; compulsory social security | 59 401 063 | 146.4 | 0.9 |
| Education | 133 422 083 | 121.5 | 2.0 |
| Healthcare and social services for the population | 113 686 177 | 150.9 | 1.7 |
| Arts, entertainment and recreation | 67 064 519 | 102.9 | 1.0 |
| Provision of other types of services | 16 644 116 | 47.7 | 0.2 |
Investments in fixed capital - investments in order for investors to obtain an economic, social or environmental ef-fect in the case of new construction, as well as expansion, reconstruction and modernization of facilities (which lead to an increase in the initial cost of the facility), the purchase of machinery, equipment, vehicles, for the formation of the main herd, perennial plantings, etc.
The costs of construction and installation works and capital repairs include the costs of a complex of works on the construction of buildings and structures, expansion, reconstruction, installation of energy, technological and other equip-ment, as well as the costs of capital repairs of non-residential, residential buildings and structures.
The cost of purchasing machinery and equipment - an element of the technological structure of investments, in-cluding the cost of purchasing machinery, vehicles, equipment.
Other costs in the volume of investments in fixed capital – the costs of design and survey work, supervision, maintenance of directorates of objects under construction, the costs of cultivated biological costs, as well as the costs of objects created or acquired by organizations used in economic activity for more than one year, having a monetary valua-tion, having the ability to alienate and generating income, but which are not material values.
The index of the physical volume of investments in fixed capital characterizes the change in investment invest-ments in dynamics, is determined by the ratio of the volume of investments in fixed capital in the reporting and compared period at comparable prices
Statistical information on investments in fixed capital is formed on the basis of primary statistical data of national statistical observations of economic entities engaged in investment activities (regardless of the number of employees and type of economic activity) and national statistical observations on the commissioning of facilities by individual developers.
Accounting of investment investments is provided at the place of actual implementation, regardless of the place of registration of the economic entity engaged in investment activities.
Operational data on investments in fixed capital, formed on a monthly basis, are updated with annual data.
By types of economic activity, data on investments in fixed capital are formed according to the direction of use (depends on the nature of the direction of investment (end use) and by the type of economic activity of the investor.
More detailed methodological explanations are available at the following link:
Methodology for the formation of indicators of investment activity statistics


