Bureau of National Statistics
of the Agency for Strategic Planning and Reforms of the Republic of Kazakhstan
Decrease in the IPV of investments in fixed capital was observed in Akmola – by 36.7%, Atyrau - by 29.5%, Abay – by 25.9%, Shygys Kazakhstan – by 10.7%, Aktobe– by 10.5% and Mangystau - by 10.3% regions.
At the same time, the increase in the IPV of investments in fixed capital is observed in Soltustik Kazakhstan - by 48.8%, Zhetisu – by 42%, Kyzylorda – by 32.8% and Turkistan – by 31% regions, in Astana city – by 30.8%, Zhambyl - by 24.4% and Almaty - by 21.8% regions.
The significant share of investments falls on Atyrau region (16.9%).
| March 2024 to | January-March 2024 by January-March 2023 | ||
|---|---|---|---|
| February 2024 | March 2023 | ||
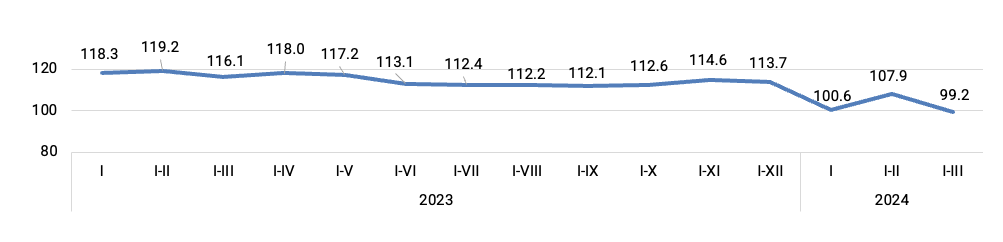
| Republic of Kazakhstan | 98.9 | 86.7 | 99.2 |
| Abay | 113.4 | 53.4 | 74.1 |
| Akmola | 77.1 | 71.6 | 63.3 |
| Aktobe | 88.9 | 77.0 | 89.5 |
| Almaty | 89.8 | 95.2 | 121.8 |
| Atyrau | 87.6 | 57.8 | 70.5 |
| Batys Kazakhstan | 57.4 | 71.2 | 108.5 |
| Zhambyl | 294.8 | 132.3 | 124.4 |
| Zhetisu | 102.7 | 134.4 | 142.0 |
| Karagandy | 175.3 | 132.3 | 119.4 |
| Kostanay | 69.7 | 76.8 | 100.3 |
| Kyzylorda | 86.4 | 90.9 | 132.8 |
| Mangystau | 137.1 | 80.6 | 89.7 |
| Pavlodar | 125.1 | 110.2 | 118.6 |
| Soltustik Kazakhstan | 193.7 | 164.8 | 148.8 |
| Turkistan | 110.5 | 109.8 | 131.0 |
| Ulytau | 119.0 | 84.6 | 100.1 |
| Shygys Kazakhstan | 89.2 | 63.8 | 89.3 |
| Astana city | 61.2 | 91.1 | 130.8 |
| Almaty city | 83.6 | 91.6 | 111.4 |
| Shymkent city | 121.9 | 115.1 | 110.9 |
About half of the national volume of capital investments is carried out by large and medium-sized enterprises.
| Mastered investments in fixed capital | Including | |||
|---|---|---|---|---|
| small businesses | medium -sized enterprises | large enterprises | ||
| January-March 2023 | 2 741 366 661 | 1 286 448 562 | 166 944 490 | 1 287 973 609 |
| January-March 2024 | 2 816 346 964 | 1 529 809 866 | 246 053 034 | 1 040 484 064 |
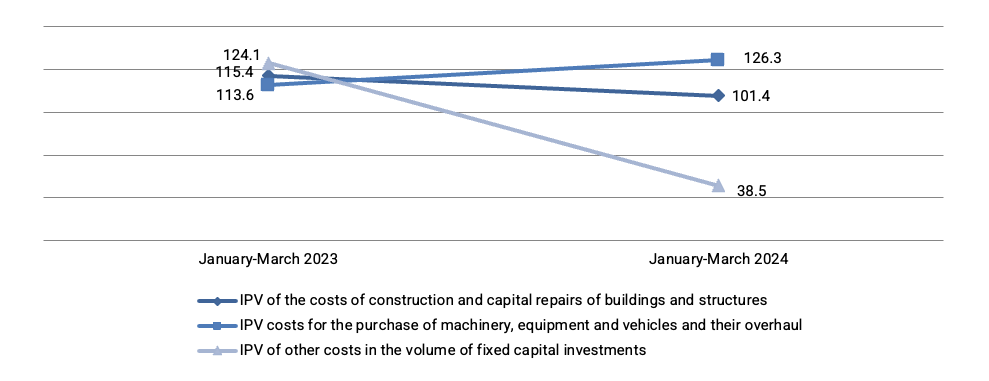
59.6% of the total costs are for construction and major repairs of buildings and structures, more than a quarter of the total amount is for the purchase of machinery, equipment and vehicles.
The predominant sources of investment financing remain the own funds of economic entities, the volume of which in January-March 2024 amounted to 2171.9 billion tenge or 77.1% of the total.
Budget funds accounted for 9.1% of the total investment in fixed capital, while compared with January-March 2023 decreased by 13.9%.
For the banking sector, the financing of the real sector of the economy in the total volume of investments in fixed capital takes 3.5%.
| January-March 2024 | For reference: as a percentage of the total | ||
|---|---|---|---|
| thousand tenge | as a percentage of the total | January-March 2023 | |
| Investments in fixed capital | 2 816 346 964 | 100.0 | 100.0 |
| including at the expense of funds: | |||
| state budget | 257 310 566 | 9.1 | 10.5 |
| Ownfunds | 2 171 863 314 | 77.1 | 80.8 |
| Bankloans | 98 521 633 | 3.5 | 1.5 |
| of them: | |||
| loans from foreign banks | 14 906 298 | 0.5 | - |
| other borrowed funds | 288 651 451 | 10.3 | 7.2 |
| of them: | |||
| borrowed funds of non-residents | 66 238 767 | 2.4 | 2.2 |
A main share of investments in fixed capital in January-March 2024 accounted for industry (47%) (includ-ing mining and quarrying – 28.4%, manufacturing industry - 11.2%), operations with real estate (21.5%), transport and warehousing (13.5%) and agriculture, forestry and fisheries (4.4%).
|
Investments in fixed capital, thousand tenge |
in % by January-March 2023 | Share in the total volume of investments, as a percentage | |
|---|---|---|---|
|
Total |
2 816 346 964 | 99.2 | 100.0 |
|
Including: |
|||
|
Agriculture, forestry and fisheries |
122 848 942 | 81.8 | 4.4 |
|
Industry |
1 323 620 822 | 90.7 | 47.0 |
|
Including: |
|||
|
Mining and quarrying |
799 502 605 | 76.3 | 28.4 |
|
Manufacturing industry |
316 246 116 | 130.2 | 11.2 |
|
Supply of electricity, gas, steam, hot water and air conditioning |
150 548 772 | 147.5 | 5.3 |
|
Water supply; collection, treatment and disposal of waste, activities for the elimination of pollution |
57 323 316 | 83.7 | 2.0 |
|
Construction |
37 462 235 | 194.3 | 1.3 |
|
Wholesale and retail trade; car and motorcycle repair |
67 020 116 | 85.7 | 2.4 |
|
Transport and warehousing |
379 968 839 | 151.2 | 13.5 |
|
Provision of accommodation and food services |
30 432 829 | 126.7 | 1.1 |
|
Information and communication |
43 891 552 | 174.6 | 1.6 |
|
Financial and insurance activities |
31 523 146 | 174.9 | 1.1 |
|
Operations with real estate |
604 218 176 | 96.3 | 21.5 |
|
Professional, scientific and technical activities |
17 775 469 | 66.5 | 0.6 |
|
Administrative and support services activities |
15 172 389 | 73.7 | 0.5 |
|
Public administration and defense; compulsory social security |
11 077 407 | 40.4 | 0.4 |
|
Education |
49 290 000 | 87.7 | 1.8 |
|
Healthcare and social services for the population |
51 227 751 | 81.9 | 1.8 |
|
Arts, entertainment and recreation |
27 829 195 | 120.6 | 1.0 |
|
Provision of other types of services |
2 988 069 | 102.7 | 0.1 |
Investments in fixed capital - investments in order for investors to obtain an economic, social or environmental ef-fect in the case of new construction, as well as expansion, reconstruction and modernization of facilities (which lead to an increase in the initial cost of the facility), the purchase of machinery, equipment, vehicles, for the formation of the main herd, perennial plantings, etc.
The costs of construction and installation works and capital repairs include the costs of a complex of works on the construction of buildings and structures, expansion, reconstruction, installation of energy, technological and other equip-ment, as well as the costs of capital repairs of non-residential, residential buildings and structures.
The cost of purchasing machinery and equipment - an element of the technological structure of investments, in-cluding the cost of purchasing machinery, vehicles, equipment.
Other costs in the volume of investments in fixed capital – the costs of design and survey work, supervision, maintenance of directorates of objects under construction, the costs of cultivated biological costs, as well as the costs of objects created or acquired by organizations used in economic activity for more than one year, having a monetary valua-tion, having the ability to alienate and generating income, but which are not material values.
The index of the physical volume of investments in fixed capital characterizes the change in investment invest-ments in dynamics, is determined by the ratio of the volume of investments in fixed capital in the reporting and compared period at comparable prices
Statistical information on investments in fixed capital is formed on the basis of primary statistical data of national statistical observations of economic entities engaged in investment activities (regardless of the number of employees and type of economic activity) and national statistical observations on the commissioning of facilities by individual developers.
Accounting of investment investments is provided at the place of actual implementation, regardless of the place of registration of the economic entity engaged in investment activities.
Operational data on investments in fixed capital, formed on a monthly basis, are updated with annual data.
By types of economic activity, data on investments in fixed capital are formed according to the direction of use (depends on the nature of the direction of investment (end use) and by the type of economic activity of the investor.
More detailed methodological explanations are available at the following link:
Methodology for the formation of indicators of investment activity statisticsStatistical compilation "Investment and construction activities in the Republic of Kazakhstan"


