Bureau of National Statistics
of the Agency for Strategic Planning and Reforms of the Republic of Kazakhstan
Significant growth was noted in Mangystau region – by 34.3%, Abai region – by 32.7%, Turkistan region – by 26.1%, Shymkent city – by 26%, Pavlodar region – by 25.6%, Almaty city – by 25.3%, Zhambyl region – by 17.3% and Soltustik Kazakhstan region by 17.3%.
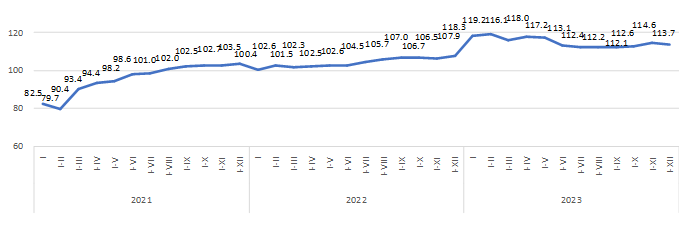
Since August 2021, the volume of investments has been steadily increasing positively in comparison with the corresponding period last year.
The significant share of investments falls on Atyrau region (17.3%).
| December 2023 to | January-December 2023 by 2022 | ||
|---|---|---|---|
| November 2023 | December 2022 | ||
| Republic of Kazakhstan | 139.9 | 109.0 | 113.7 |
| Abai | 209.3 | 103.6 | 132.7 |
| Akmola | 241.6 | 119.0 | 107.1 |
| Aktobe | 130,6 | 103.1 | 109.5 |
| Almaty | 132.2 | 96.3 | 110.7 |
| Atyrau | 163.3 | 102.2 | 100.7 |
| Batys Kazakhstan | 160.8 | 93.9 | 116.4 |
| Zhambyl | 226.9 | 131.9 | 117.3 |
| Zhetisu | 210.4 | 122.6 | 115.4 |
| Karagandy | 147.6 | 94.0 | 112.2 |
| Kostanai | 267.0 | 120.0 | 109.0 |
| Kyzylorda | 120.7 | 90.1 | 114.2 |
| Mangystau | 85.6 | 86.1 | 134.3 |
| Pavlodar | 151.7 | 112.3 | 125.6 |
| Soltustik Kazakhstan | 139,3 | 95.4 | 117.3 |
| Turkistan | 128.7 | 73.3 | 126.1 |
| Ulytau | 207.5 | 107.1 | 114.0 |
| Shygys Kazakhstan | 129.6 | 146.2 | 113.9 |
| Astana city | 181.9 | 114.5 | 106.6 |
| Almaty city | 80.2 | 171.9 | 125.3 |
| Shymkent city | 94.5 | 166.1 | 126.0 |
About half of the national volume of capital investments is carried out by large and medium-sized enterprises.
| Mastered investments in fixed capital | Including | |||
|---|---|---|---|---|
| small businesses | medium -sized enterprises | large enterprises | ||
| 2021 | 13 242 233 420 | 7 127 645 084 | 1 128 594 126 | 4 985 994 210 |
| 2022 | 15 251 104 090 | 8 156 215 530 | 947 478 819 | 6 147 409 741 |
| January-December 2023 | 18 043 687 257 | 9 836 176 360 | 1 174 262 818 | 7 033 248 079 |
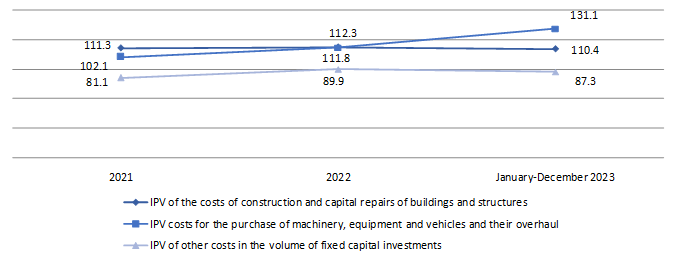
59.5% of the total costs are for construction and major repairs of buildings and structures, more than a quarter of the total amount is for the purchase of machinery, equipment and vehicles.
The predominant sources of investment financing remain the own funds of economic entities, the volume of which in January-December 2023 amounted to 13279.8 billion tenge or 73.6% of the total.
The predominant sources of investment financing remain the own funds of economic entities, the volume of which in January-December 2023 amounted to 13279.8 billion tenge or 73.6% of the total.
For the banking sector, the financing of the real sector of the economy in the total volume of investments in fixed capital takes 2.5%.
| January-December 2023 | For reference: as a percentage of the total | |||
|---|---|---|---|---|
| thousand tenge | as a percentage of the total | 2022 | 2021 | |
| Investments in fixed capital | 18 043 687 257 | 100.0 | 100.0 | 100.0 |
| including at the expense of funds: | ||||
| state budget | 2 850 117 810 | 15.8 | 15.5 | 15.6 |
| Ownfunds | 13 279 782 562 | 73.6 | 73.2 | 70.7 |
| Bankloans | 445 356 629 | 2.5 | 3.2 | 2.6 |
| of them: | ||||
| loans from foreign banks | 21 930 223 | 0.1 | 0.2 | 0.5 |
| other borrowed funds | 1 468 430 256 | 8.1 | 8.1 | 11.1 |
| of them: | ||||
| borrowed funds of non-residents | 459 926 236 | 2.5 | 1.9 | 2.2 |
A main share of investments in fixed capital in January-December 2023 accounted for industry (45.7%) (includ-ing mining and quarrying - 26.3%, manufacturing industry - 9.4%), operations with real estate (17.9%), transport and warehousing (14%) and agriculture, forestry and fisheries (5.4%).
| Investments in fixed capital, thousand tenge | in % by 2022 | Share in the total volume of investments, as a percentage | |
|---|---|---|---|
| Total | 18 043 687 257 | 113.7 | 100.0 |
| Including: | |||
| Agriculture, forestry and fisheries | 981 049 914 | 110.3 | 5.4 |
| Industry | 8 241 210 161 | 107.3 | 45.7 |
| Including: | |||
| Mining and quarrying | 4 752 850 939 | 102.4 | 26.3 |
| Manufacturing industry | 1 704 825 774 | 103.2 | 9.4 |
| Supply of electricity, gas, steam, hot water and air conditioning | 1 184 926 414 | 138.9 | 6.6 |
| Water supply; collection, treatment and disposal of waste, activities for the elimination of pollution | 598 606 998 | 114.3 | 3.3 |
| Construction | 187 703 274 | 83.7 | 1.0 |
| Wholesale and retail trade; car and motorcycle repair | 489 810 278 | 132.7 | 2.7 |
| Transport and warehousing | 2 522 809 512 | 140.3 | 14.0 |
| Provision of accommodation and food services | 143 871 116 | 104.5 | 0.8 |
| Information and communication | 451 661 728 | 230.2 | 2.5 |
| Financial and insurance activities | 119 489 741 | 95.9 | 0.7 |
| Operations with real estate | 3 231 217 048 | 105.5 | 17.9 |
| Professional, scientific and technical activities | 94 800 185 | 151.0 | 0.5 |
| Administrative and support services activities | 160 199 143 | 102.0 | 0.9 |
| Public administration and defense; compulsory social security | 178 777 617 | 104.3 | 1.0 |
| Education | 448 712 477 | 115.3 | 2.5 |
| Healthcare and social services for the population | 409 996 238 | 151.1 | 2.3 |
| Arts, entertainment and recreation | 298 630 770 | 111.4 | 1.7 |
| Provision of other types of services | 83 747 897 | 124.8 | 0.5 |
Investments in fixed capital - investments in order for investors to obtain an economic, social or environmental ef-fect in the case of new construction, as well as expansion, reconstruction and modernization of facilities (which lead to an increase in the initial cost of the facility), the purchase of machinery, equipment, vehicles, for the formation of the main herd, perennial plantings, etc.
The costs of construction and installation works and capital repairs include the costs of a complex of works on the construction of buildings and structures, expansion, reconstruction, installation of energy, technological and other equip-ment, as well as the costs of capital repairs of non-residential, residential buildings and structures.
The cost of purchasing machinery and equipment - an element of the technological structure of investments, in-cluding the cost of purchasing machinery, vehicles, equipment.
Other costs in the volume of investments in fixed capital – the costs of design and survey work, supervision, maintenance of directorates of objects under construction, the costs of cultivated biological costs, as well as the costs of objects created or acquired by organizations used in economic activity for more than one year, having a monetary valua-tion, having the ability to alienate and generating income, but which are not material values.
The index of the physical volume of investments in fixed capital characterizes the change in investment invest-ments in dynamics, is determined by the ratio of the volume of investments in fixed capital in the reporting and compared period at comparable prices
Statistical information on investments in fixed capital is formed on the basis of primary statistical data of national statistical observations of economic entities engaged in investment activities (regardless of the number of employees and type of economic activity) and national statistical observations on the commissioning of facilities by individual developers.
Accounting of investment investments is provided at the place of actual implementation, regardless of the place of registration of the economic entity engaged in investment activities.
Operational data on investments in fixed capital, formed on a monthly basis, are updated with annual data.
By types of economic activity, data on investments in fixed capital are formed according to the direction of use (depends on the nature of the direction of investment (end use) and by the type of economic activity of the investor.
More detailed methodological explanations are available at the following link:
Methodology for the formation of indicators of investment activity statisticsStatistical compilation "Investment and construction activities in the Republic of Kazakhstan"


