Bureau of National Statistics
of the Agency for Strategic Planning and Reforms of the Republic of Kazakhstan
Significant growth was noted in Mangystau region – by 44%, Turkistan region – by 41.1%, Abai region – by 40.8%, Pavlodar region – by 28.2%, Soltustik Kazakhstan region 22.3%, Batys Kazakhstan region – by 22.2% and Shymkent city – by 21.3%.
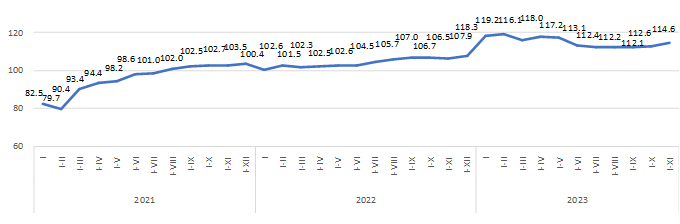
Since August 2021, the volume of investments has been steadily increasing positively in comparison with the corresponding period last year.
The significant share of investments falls on Atyrau region (17.6%).
| November 2023 to | January-November 2023 by January-November 2022 | ||
|---|---|---|---|
| October 2023 | November 2022 | ||
| Republic of Kazakhstan | 115.5 | 131.5 | 114.6 |
| Abai | 69.1 | 115.3 | 140.8 |
| Akmola | 81.0 | 84.6 | 105.4 |
| Aktobe | 104.4 | 137.3 | 111.3 |
| Almaty | 102.5 | 141.7 | 114.2 |
| Atyrau | 109.3 | 117.0 | 100.4 |
| Batys Kazakhstan | 111.8 | 122.2 | 122.2 |
| Zhambyl | 91.9 | 143.5 | 114.6 |
| Zhetisu | 131.4 | 83.6 | 113.5 |
| Karagandy | 115.8 | 114.2 | 116.3 |
| Kostanai | 96.0 | 104.7 | 107.2 |
| Kyzylorda | 66.8 | 73.1 | 118.4 |
| Mangystau | 115.0 | 145.7 | 144.0 |
| Pavlodar | 97.3 | 129.1 | 128.2 |
| Soltustik Kazakhstan | 111.4 | 136.9 | 122.3 |
| Turkistan | 106.8 | 139.8 | 141.1 |
| Ulytau | 91.0 | 78.5 | 115.5 |
| Shygys Kazakhstan | 135.7 | 169.3 | 109.3 |
| Astana city | 121.2 | 116.1 | 104.7 |
| Almaty city | 194.3 | 234.9 | 119.9 |
| Shymkent city | 134.3 | 116.9 | 121.3 |
About half of the national volume of capital investments is carried out by large and medium-sized enterprises.
| Mastered investments in fixed capital | Including | |||
|---|---|---|---|---|
| small businesses | medium -sized enterprises | large enterprises | ||
| January-November 2021 | 11 252 093 669 | 6 184 135 935 | 911 407 857 | 4 156 549 877 |
| January-November 2022 | 12 670 713 137 | 6 869 400 271 | 616 409 254 | 5 184 903 612 |
| January-November 2023 | 15 292 484 053 | 8 209 967 299 | 979 035 102 | 6 103 481 652 |
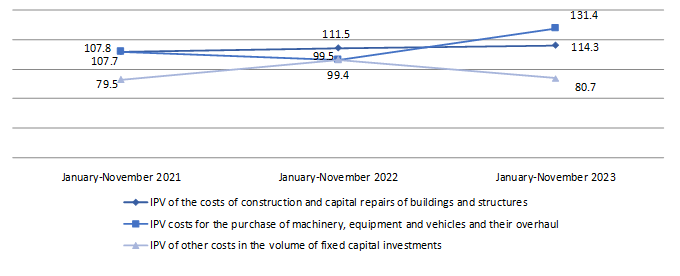
59.6% of the total costs are for construction and major repairs of buildings and structures, more than a quarter of the total amount is for the purchase of machinery, equipment and vehicles.
The predominant sources of investment financing remain the own funds of economic entities, the volume of which in January-November 2023 amounted to 11487 billion tenge or 75.1% of the total.
Budget funds accounted for 14.8% of the total investment in fixed capital, while compared with January-November 2022 increased by 19.5%.
For the banking sector, the financing of the real sector of the economy in the total volume of investments in fixed capital takes 2.4%.
| January-November 2023 | For reference: as a percentage of the total | |||
|---|---|---|---|---|
| thousand tenge | as a percentage of the total | January-November 2022 | January-November 2021 | |
| Investments in fixed capital | 15 292 484 053 | 100.0 | 100.0 | 100.0 |
| including at the expense of funds: | ||||
| state budget | 2 265 466 989 | 14.8 | 14.4 | 14.5 |
| Ownfunds | 11 487 034 053 | 75.1 | 74.5 | 71.8 |
| Bankloans | 372 187 400 | 2.4 | 2.3 | 2.6 |
| of them: | ||||
| loans from foreign banks | 16 587 699 | 0.1 | 0.2 | 0.6 |
| other borrowed funds | 1 167 795 611 | 7.7 | 8.8 | 11.1 |
| of them: | ||||
| borrowed funds of non-residents | 397 167 405 | 2.6 | 2.0 | 2.0 |
A main share of investments in fixed capital in January-November 2023 accounted for industry (46.1%) (includ-ing mining and quarrying - 27.6%, manufacturing industry - 9.1%), operations with real estate (18.2%), transport and warehousing (14%) and agriculture, forestry and fisheries (5.6%).
| Investments in fixed capital, thousand tenge | in % by January-November 2022 | Share in the total volume of investments, as a percentage | |
|---|---|---|---|
| Total | 15 292 484 053 | 114.6 | 100.0 |
| Including: | |||
| Agriculture, forestry and fisheries | 854 659 603 | 111.3 | 5.6 |
| Industry | 7 051 176 441 | 108.5 | 46.1 |
| Including: | |||
| Mining and quarrying | 4 216 817 205 | 101.4 | 27.6 |
| Manufacturing industry | 1 394 823 165 | 104.6 | 9.1 |
| Supply of electricity, gas, steam, hot water and air conditioning | 962 205 106 | 157.0 | 6.3 |
| Water supply; collection, treatment and disposal of waste, activities for the elimination of pollution | 477 330 971 | 123.8 | 3.1 |
| Construction | 164 770 184 | 88.8 | 1.1 |
| Wholesale and retail trade; car and motorcycle repair | 410 553 546 | 133.8 | 2.7 |
| Transport and warehousing | 2 136 677 817 | 158.1 | 14.0 |
| Provision of accommodation and food services | 120 297 313 | 104.3 | 0.8 |
| Information and communication | 373 768 573 | 284.4 | 2.4 |
| Financial and insurance activities | 95 033 558 | 88.9 | 0.6 |
| Operations with real estate | 2 778 363 621 | 100.2 | 18.2 |
| Professional, scientific and technical activities | 77 617 955 | 162.2 | 0.5 |
| Administrative and support services activities | 142 449 278 | 117.2 | 0.9 |
| Public administration and defense; compulsory social security | 138 922 384 | 116.2 | 0.9 |
| Education | 372 410 542 | 117.0 | 2.4 |
| Healthcare and social services for the population | 300 004 075 | 136.2 | 2.0 |
| Arts, entertainment and recreation | 217 262 540 | 117.9 | 1.4 |
| Provision of other types of services | 58 516 460 | 82.1 | 0.4 |
Investments in fixed capital - investments in order for investors to obtain an economic, social or environmental ef-fect in the case of new construction, as well as expansion, reconstruction and modernization of facilities (which lead to an increase in the initial cost of the facility), the purchase of machinery, equipment, vehicles, for the formation of the main herd, perennial plantings, etc.
The costs of construction and installation works and capital repairs include the costs of a complex of works on the construction of buildings and structures, expansion, reconstruction, installation of energy, technological and other equip-ment, as well as the costs of capital repairs of non-residential, residential buildings and structures.
The cost of purchasing machinery and equipment - an element of the technological structure of investments, in-cluding the cost of purchasing machinery, vehicles, equipment.
Other costs in the volume of investments in fixed capital – the costs of design and survey work, supervision, maintenance of directorates of objects under construction, the costs of cultivated biological costs, as well as the costs of objects created or acquired by organizations used in economic activity for more than one year, having a monetary valua-tion, having the ability to alienate and generating income, but which are not material values.
The index of the physical volume of investments in fixed capital characterizes the change in investment invest-ments in dynamics, is determined by the ratio of the volume of investments in fixed capital in the reporting and compared period at comparable prices
Statistical information on investments in fixed capital is formed on the basis of primary statistical data of national statistical observations of economic entities engaged in investment activities (regardless of the number of employees and type of economic activity) and national statistical observations on the commissioning of facilities by individual developers.
Accounting of investment investments is provided at the place of actual implementation, regardless of the place of registration of the economic entity engaged in investment activities.
Operational data on investments in fixed capital, formed on a monthly basis, are updated with annual data.
By types of economic activity, data on investments in fixed capital are formed according to the direction of use (depends on the nature of the direction of investment (end use) and by the type of economic activity of the investor.
More detailed methodological explanations are available at the following link:
Methodology for the formation of indicators of investment activity statisticsStatistical compilation "Investment and construction activities in the Republic of Kazakhstan"


