Bureau of National Statistics
of the Agency for Strategic Planning and Reforms of the Republic of Kazakhstan
In the regional context, there was an increase in investments in fixed capital in 18 regions of the republic. At the same time, the greatest growth was observed in the Kyzylorda region and the Zhetisu region (1.3 times), Pavlodar and Mangystau regions (1.2 times). A decrease in investments in fixed capital was recorded in 2 regions of the republic - in the Atyrau region (by 0.4%) and the Ulytau region (by 7.9%).
| Investments in fixed capital, thousand tenge | as a percentage by 2021 | The share of regions in the republican volume of investments in fixed capital, as a percentage | |
|---|---|---|---|
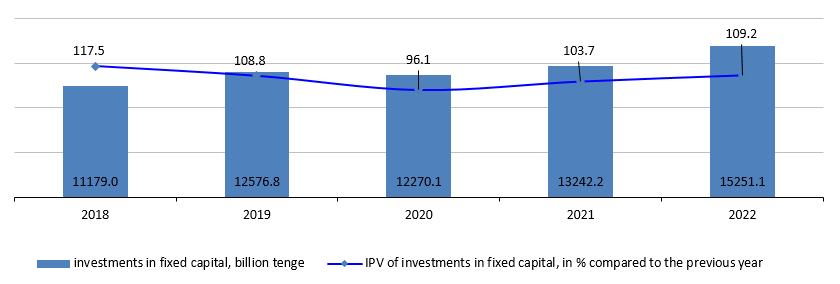
| Republic of Kazakhstan | 15 251 104 090 | 109.2 | 100.0 |
| Abai | 414 497 362 | 105.9 | 2.7 |
| Akmola | 579 972 904 | 106.8 | 3.8 |
| Aktobe | 960 038 538 | 110.3 | 6.3 |
| Almaty | 613 940 487 | 115.3 | 4.0 |
| Atyrau | 3 003 503 184 | 99.6 | 19.7 |
| Batys Kazakhstan | 537 886 227 | 117.7 | 3.5 |
| Zhambyl | 428 501 575 | 102.3 | 2.8 |
| Zhetisu | 291 989 301 | 126.2 | 1.9 |
| Karagandy | 724 917 845 | 110.7 | 4.8 |
| Kostanai | 492 069 660 | 107.7 | 3.2 |
| Kyzylorda | 413 284 091 | 127.8 | 2.7 |
| Mangystau | 785 759 298 | 119.2 | 5.2 |
| Pavlodar | 742 793 468 | 119.7 | 4.9 |
| Soltustik Kazakhstan | 368 460 383 | 104.1 | 2.4 |
| Turkistan | 742 587 923 | 109.1 | 4.9 |
| Ulytau | 175 499 451 | 92.1 | 1.2 |
| Shygys Kazakhstan | 555 270 644 | 113.2 | 3.6 |
| Astana city | 1 462 523 930 | 113.5 | 9.6 |
| Almaty city | 1 407 989 996 | 112.5 | 9.2 |
| Shymkent city | 549 617 823 | 113.8 | 3.6 |
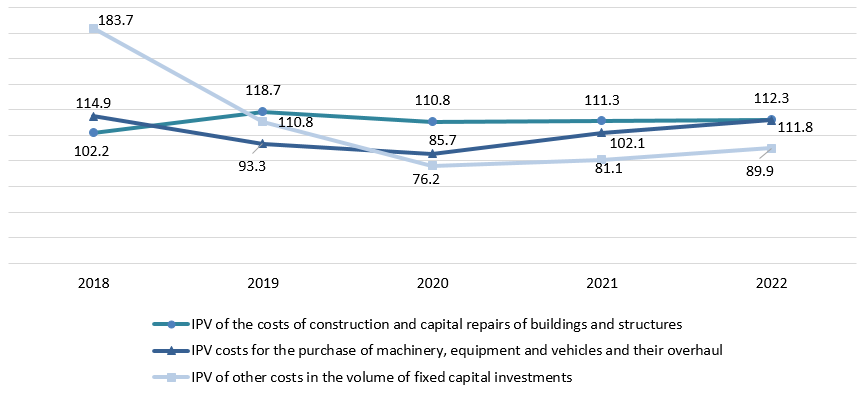
In the technological structure of investments in fixed capital, 60.8% of the costs fall on construction and capital repairs of buildings and structures (almost 70% of them were carried out by private enterprises), 28% - the cost of purchasing machinery, equipment and vehicles and their capital repair, 11.2% - other costs in the volume of investments in fixed capital.
About half of the national volume of capital investments is carried out by large and medium-sized enterprises.
| Mastered investments in fixed capital | Including | |||
|---|---|---|---|---|
| small businesses | medium-sized enterprises | large enterprises | ||
| 2020 | 12 270 144 010 | 6 007 370 054 | 885 202 580 | 5 377 571 376 |
| 2021 | 13 242 233 420 | 7 127 645 084 | 1 128 594 126 | 4 985 994 210 |
| 2022 | 15 251 104 090 | 8 156 215 530 | 947 478 819 | 6 147 409 741 |
The predominant sources of investment financing remain the own funds of economic entities, the volume of which in 2022 amounted to 11 161 billion tenge or 73.2% of the total.
Of the funds raised, 15.5% were budget funds, 8.1% were other borrowed funds, 3.2% were bank loans.
| 2022 | For reference: as a percentage of the total | |||
|---|---|---|---|---|
| thousand tenge | as a percentage of the total | 2021 | 2020 | |
| Investments in fixed capital | 15 251 104 090 | 100.0 | 100.0 | 100.0 |
| including at the expense of funds: | ||||
| state budget | 2 368 507 596 | 15.5 | 15.6 | 19.2 |
| ownfunds | 11 161 041 078 | 73.2 | 70.7 | 68.7 |
| bank loans | 483 220 847 | 3.2 | 2.6 | 2.3 |
| of them: | ||||
| loans from foreign banks | 27 004 598 | 0.2 | 0.5 | 0.4 |
| other borrowed funds | 1 238 344 569 | 8.1 | 11.1 | 9.8 |
| of them: | ||||
| borrowed funds of non-residents | 294 974 652 | 1.9 | 2.2 | 2.8 |
The main share of investments in fixed capital in 2022 falls on industry (48.4%) (including the mining industry and quarrying–29.2%), real estate operations (19.3%) and transport and warehousing (11.3%).
| Investments in fixed capital, thousand tenge | as a percentage by 2021 | Share in the total volume of investments, as a percentage | |
|---|---|---|---|
| Total | 15 251 104 090 | 109.2 | 100.0 |
| Including: | |||
| Agriculture, forestry and fisheries | 850 346 200 | 106.3 | 5.6 |
| Industry | 7 380 077 725 | 107.6 | 48.4 |
| Including: | |||
| Mining and quarrying | 4 458 971 791 | 114.0 | 29.2 |
| Manufacturing industry | 1 586 872 194 | 97.6 | 10.4 |
| Supply of electricity, gas, steam, hot water and air conditioning | 828 749 153 | 106.0 | 5.4 |
| Water supply; collection, treatment and disposal of waste, activities for the elimination of pollution | 505 484 587 | 102.6 | 3.3 |
| Construction | 223 241 498 | 171.9 | 1.5 |
| Wholesale and retail trade; car and motorcycle repair | 354 566 425 | 124.2 | 2.3 |
| Transport and warehousing | 1 725 317 431 | 114.8 | 11.3 |
| Provision of accommodation and food services | 132 291 864 | 72.2 | 0.9 |
| Information and communication | 192 394 862 | 127.3 | 1.3 |
| Financial and insurance activities | 119 660 433 | 118.3 | 0.8 |
| Operations with realestate | 2 939 761 536 | 110.9 | 19.3 |
| Professional, scientific and technical activities | 60 296 748 | 83.4 | 0.4 |
| Administrative and support services activities | 150 842 311 | 92.2 | 1.0 |
| Public administration and defense; compulsory social security | 164 715 216 | 234.8 | 1.1 |
| Education | 374 200 454 | 129.3 | 2.5 |
| Healthcare and social services for the population | 260 666 128 | 136.3 | 1.7 |
| Arts, entertainment and recreation | 257 499 757 | 92.3 | 1.7 |
| Provision of other types of services | 65 225 502 | 104.3 | 0.4 |
Investments in fixed capital - investments in order for investors to obtain an economic, social or environmental effect in the case of new construction, as well as expansion, reconstruction and modernization of facilities (which lead to an increase in the initial cost of the facility), the purchase of machinery, equipment, vehicles, for the formation of the main herd, perenni-al plantings, etc.
The costs of construction and installation works and capital repairs include the costs of a complex of works on the con-struction of buildings and structures, expansion, reconstruction, installation of energy, technological and other equipment, as well as the costs of capital repairs of non-residential, residential buildings and structures.
The cost of purchasing machinery and equipment - an element of the technological structure of investments, including the cost of purchasing machinery, vehicles, equipment.
Other costs in the volume of investments in fixed capital – the costs of design and survey work, supervision, mainte-nance of directorates of objects under construction, the costs of cultivated biological costs, as well as the costs of objects cre-ated or acquired by organizations used in economic activity for more than one year, having a monetary valuation, having the ability to alienate and generating income, but which are not material values.
The index of the physical volume of investments in fixed capital characterizes the change in investment investments in dynamics, is determined by the ratio of the volume of investments in fixed capital in the reporting and compared period at comparable prices
Statistical information on investments in fixed capital is formed on the basis of primary statistical data of national statistical observations of economic entities engaged in investment activities (regardless of the number of employees and type of economic activity) and national statistical observations on the commissioning of facilities by individual developers.
Accounting of investment investments is provided at the place of actual implementation, regardless of the place of registration of the economic entity engaged in investment activities.
Operational data on investments in fixed capital, formed on a monthly basis, are updated with annual data.
By types of economic activity, data on investments in fixed capital are formed according to the direction of use (depends on the nature of the direction of investment (end use) and by the type of economic activity of the investor.
More detailed methodological explanations are available at the following link:


