Bureau of National Statistics
of the Agency for Strategic Planning and Reforms of the Republic of Kazakhstan
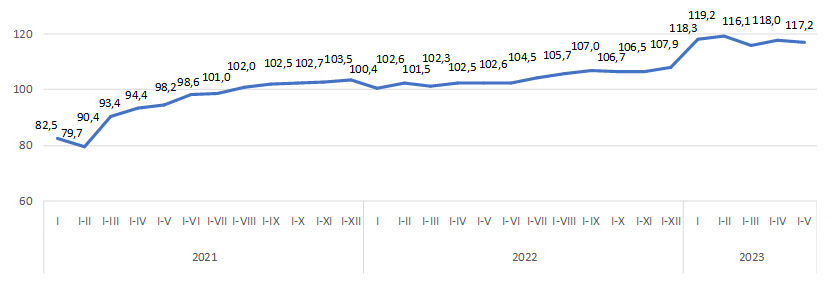
Since August 2021, the volume of investments has been steadily increasing positively in comparison with the corre-sponding period last year.
The significant share of investments falls on Atyrau region (22.5%).
| May 2023 to | January-May 2023 by January-May 2022 | ||
|---|---|---|---|
| April 2023 | May 2022 | ||
|
Republic of Kazakhstan |
114,4 | 114,7 | 117,2 |
|
Abai |
204,9 | 147,3 | 121,0 |
|
Akmola |
117,9 | 112,6 | 117,8 |
|
Aktobe |
134,4 | 100,9 | 108,5 |
|
Almaty |
95,4 | 89,6 | 113,9 |
|
Atyrau |
91,5 | 90,3 | 106,7 |
|
Batys Kazakhstan |
106,0 | 131,7 | 133,7 |
|
Zhambyl |
163,0 | 161,4 | 118,0 |
|
Zhetisu |
127,2 | 103,6 | 115,0 |
|
Karagandy |
141,5 | 188,1 | 136,9 |
|
Kostanai |
111,6 | 191,4 | 138,1 |
|
Kyzylorda |
107,6 | 130,5 | 140,0 |
|
Mangystau |
87,4 | 129,5 | 142,2 |
|
Pavlodar |
247,9 | 138,2 | 129,8 |
|
Soltustik Kazakhstan |
128,8 | 72,9 | 104,0 |
|
Turkistan |
143,0 | 146,7 | 156,5 |
|
Ulytau |
95,2 | 128,6 | 125,3 |
|
Shygys Kazakhstan |
152,0 | 115,4 | 110,8 |
|
Astana city |
138,6 | 130,3 | 120,9 |
|
Almaty city |
100,5 | 104,4 | 101,4 |
|
Shymkent city |
62,2 | 132,9 | 122,1 |
About half of the national volume of capital investments is carried out by large and medium-sized enterprises.
| Mastered investments in fixed capital | Including | |||
|---|---|---|---|---|
| small businesses | medium -sized enterprises | large enterprises | ||
| January-May 2021 | 3 829 981 069 | 1 836 520 603 | 310 730 403 | 1 682 730 063 |
| January-May 2022 | 4 145 788 210 | 2 082 869 570 | 209 861 858 | 1 853 056 782 |
| January-May 2023 | 5 075 694 127 | 2 465 256 322 | 304 946 671 | 2 305 491 134 |
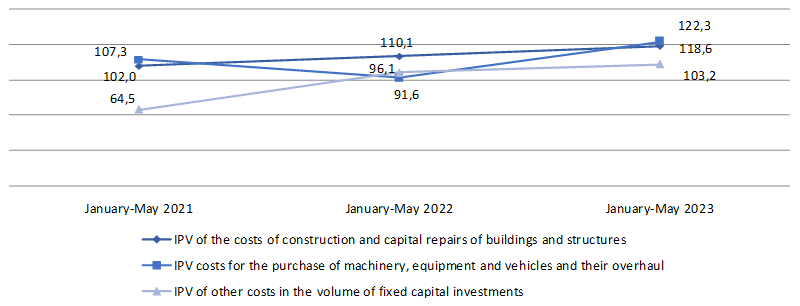
Almost 58% of the total costs are for construction and major repairs of buildings and structures, more than a quarter of the total amount is for the purchase of machinery, equipment and vehicles.
The predominant sources of investment financing remain the own funds of economic entities, the volume of which in January-May 2023 amounted to 3981.7 billion tenge or 78.5% of the total.
Budget funds accounted for 12.4% of the total investment in fixed capital, while compared with January-May 2022 in-creased by 41.6%.
For the banking sector, the financing of the real sector of the economy in the total volume of investments in fixed capi-tal takes 2.1%.
| January-May 2023 | For reference: as a percentage of the total | |||
|---|---|---|---|---|
| thousand tenge | as a percentage of the total | January-May 2022 | January-May 2021 | |
| Investments in fixed capital | 5 075 694 127 | 100,0 | 100,0 | 100,0 |
| including at the expense of funds: | ||||
| state budget | 631 418 309 | 12,4 | 10,3 | 10,4 |
| Ownfunds | 3 981 673 512 | 78,5 | 78,7 | 76,7 |
| Bankloans | 106 706 961 | 2,1 | 2,9 | 2,5 |
| of them: | ||||
| loans from foreign banks | 598 594 | - | 0,4 | 0,9 |
| other borrowed funds | 355 895 345 | 7,0 | 8,1 | 10,4 |
| of them: | ||||
| borrowed funds of non-residents | 109 975 138 | 2,2 | 1,1 | 1,4 |
A main share of investments in fixed capital in January-May 2023 accounted for industry (51.3%) (including mining and quarrying - 35.3%), operations with real estate (20.0%) and transport and warehousing (10.3%).
| Investments in fixed capital, thousand tenge | in % by January-May 2022 | Share in the total volume of investments, as a percentage | |
|---|---|---|---|
| Total | 5 075 694 127 | 117,2 | 100,0 |
| Including: | |||
| Agriculture, forestry and fisheries | 269 938 058 | 130,8 | 5,3 |
| Industry | 2 601 968 271 | 115,7 | 51,3 |
| Including: | |||
| Mining and quarrying | 1 792 039 733 | 113,4 | 35,3 |
| Manufacturing industry | 436 959 510 | 102,8 | 8,6 |
| Supply of electricity, gas, steam, hot water and air conditioning | 239 757 055 | 156,7 | 4,7 |
| Water supply; collection, treatment and disposal of waste, activities for the elimination of pollution | 133 211 973 | 158,1 | 2,6 |
| Construction | 45 708 514 | 81,6 | 0,9 |
| Wholesale and retail trade; car and motorcycle repair | 122 705 286 | 146,2 | 2,4 |
| Transport and warehousing | 523 032 607 | 156,1 | 10,3 |
| Provision of accommodation and food services | 48 913 133 | 223,9 | 1,0 |
| Information and communication | 38 197 237 | 121,3 | 0,8 |
| Financial and insurance activities | 32 836 266 | 72,9 | 0,6 |
| Operations with real estate | 1 012 708 379 | 103,0 | 20,0 |
| Professional, scientific and technical activities | 33 517 891 | 171,9 | 0,7 |
| Administrative and support services activities | 55 137 875 | 206,1 | 1,1 |
| Public administration and defense; compulsory social security | 42 879 005 | 189,8 | 0,8 |
| Education | 97 763 580 | 118,8 | 1,9 |
| Healthcare and social services for the population | 90 491 976 | 161,8 | 1,8 |
| Arts, entertainment and recreation | 50 472 641 | 105,0 | 1,0 |
| Provision of other types of services | 9 423 426 | 55,9 | 0,2 |
Investments in fixed capital - investments in order for investors to obtain an economic, social or environmental ef-fect in the case of new construction, as well as expansion, reconstruction and modernization of facilities (which lead to an increase in the initial cost of the facility), the purchase of machinery, equipment, vehicles, for the formation of the main herd, perennial plantings, etc.
The costs of construction and installation works and capital repairs include the costs of a complex of works on the construction of buildings and structures, expansion, reconstruction, installation of energy, technological and other equip-ment, as well as the costs of capital repairs of non-residential, residential buildings and structures.
The cost of purchasing machinery and equipment - an element of the technological structure of investments, in-cluding the cost of purchasing machinery, vehicles, equipment.
Other costs in the volume of investments in fixed capital – the costs of design and survey work, supervision, maintenance of directorates of objects under construction, the costs of cultivated biological costs, as well as the costs of objects created or acquired by organizations used in economic activity for more than one year, having a monetary valua-tion, having the ability to alienate and generating income, but which are not material values.
The index of the physical volume of investments in fixed capital characterizes the change in investment invest-ments in dynamics, is determined by the ratio of the volume of investments in fixed capital in the reporting and compared period at comparable prices
Statistical information on investments in fixed capital is formed on the basis of primary statistical data of national statistical observations of economic entities engaged in investment activities (regardless of the number of employees and type of economic activity) and national statistical observations on the commissioning of facilities by individual developers.
Accounting of investment investments is provided at the place of actual implementation, regardless of the place of registration of the economic entity engaged in investment activities.
Operational data on investments in fixed capital, formed on a monthly basis, are updated with annual data.
By types of economic activity, data on investments in fixed capital are formed according to the direction of use (depends on the nature of the direction of investment (end use) and by the type of economic activity of the investor.
More detailed methodological explanations are available at the following link:
Methodology for the formation of indicators of investment activity statistics


