Bureau of National Statistics
of the Agency for Strategic Planning and Reforms of the Republic of Kazakhstan
Significant growth was noted in Kyzylorda region – by 64.4%, Astana city – by 57.9%, Turkistan region – by 53.8%, Zhetisu region – by 46.9%, Almaty region – by 45.5%, Batys Kazakhstan – by 34.8%, and Soltustik Kazakhstan region by 32.4%.
The significant share of investments falls on Atyrau region (19.1%).
| February 2024 to | January-February 2024 by January-February 2023 | ||
|---|---|---|---|
| January 2024 | February 2023 | ||
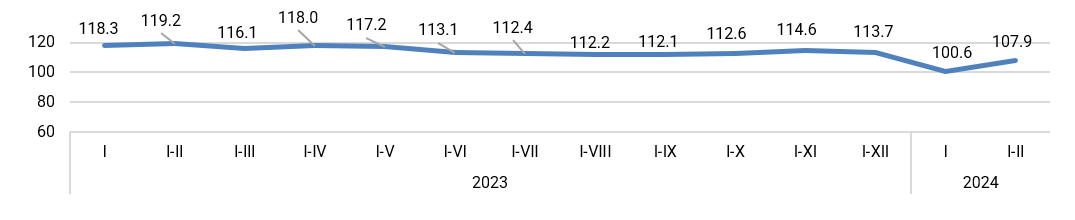
| Republic of Kazakhstan | 129.3 | 114.0 | 107.9 |
| Abay | 198.0 | 117.9 | 104.7 |
| Akmola | 141.9 | 63.2 | 60.2 |
| Aktobe | 320.6 | 125.7 | 100.5 |
| Almaty | 182.4 | 152.2 | 145.5 |
| Atyrau | 77.0 | 73.3 | 77.0 |
| Batys Kazakhstan | 190.8 | 180.8 | 134.8 |
| Zhambyl | 67.5 | 92.7 | 116.3 |
| Zhetisu | 129.1 | 119.7 | 146.9 |
| Karagandy | 123.2 | 115.8 | 109.2 |
| Kostanay | 103.2 | 123.1 | 112.8 |
| Kyzylorda | 92.8 | 220.7 | 164.4 |
| Mangystau | 73.2 | 71.9 | 96.0 |
| Pavlodar | 208.2 | 129.7 | 126.9 |
| Soltustik Kazakhstan | 199.0 | 200.4 | 132.4 |
| Turkistan | 222.8 | 167.5 | 153.8 |
| Ulytau | 84.7 | 83.1 | 111.1 |
| Shygys Kazakhstan | 194.7 | 111.3 | 116.9 |
| Astana city | 182.0 | 179.9 | 157.9 |
| Almaty city | 133.5 | 125.1 | 124.5 |
| Shymkent city | 126.3 | 111.7 | 108.3 |
About half of the national volume of capital investments is carried out by large and medium-sized enterprises.
| Mastered investments in fixed capital | Including | |||
|---|---|---|---|---|
| small businesses | medium -sized enterprises | large enterprises | ||
| January-February 2023 | 1 616 382 572 | 656 648 845 | 105 526 120 | 854 207 607 |
| January-February 2024 | 1 809 357 363 | 956 691 544 | 154 863 294 | 697 802 525 |
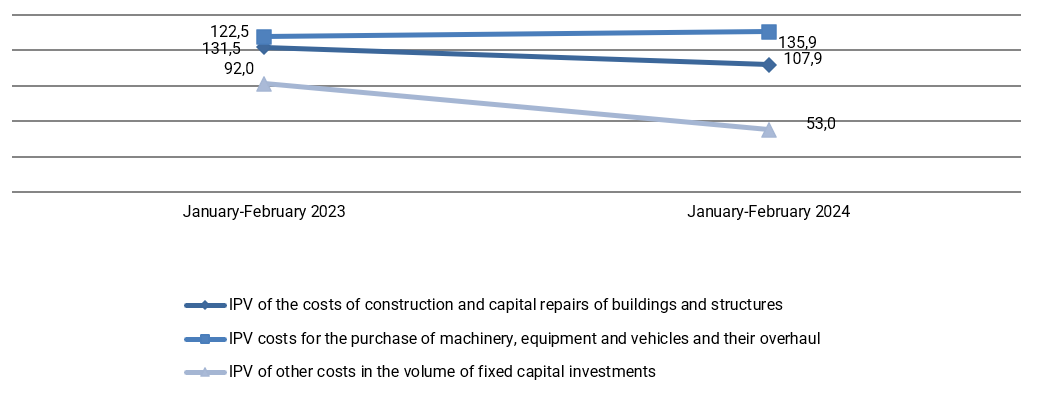
59.5% of the total costs are for construction and major repairs of buildings and structures, more than a quarter of the total amount is for the purchase of machinery, equipment and vehicles.
The predominant sources of investment financing remain the own funds of economic entities, the volume of which in January-February 2024 amounted to 1439.7 billion tenge or 79.6% of the total.
Budget funds accounted for 7% of the total investment in fixed capital, while compared with January-February 2023 decreased by 10.2%.
For the banking sector, the financing of the real sector of the economy in the total volume of investments in fixed capital takes 4%.
| January-February 2024 | For reference: as a percentage of the total | ||
|---|---|---|---|
| thousand tenge | as a percentage of the total | January-February 2023 | |
| Investments in fixed capital | 1 809 357 363 | 100.0 | 100.0 |
| including at the expense of funds: | |||
| state budget | 126 113 841 | 7.0 | 8.4 |
| Ownfunds | 1 439 651 064 | 79.6 | 81.7 |
| Bankloans | 72 907 106 | 4.0 | 1.8 |
| of them: | |||
| loans from foreign banks | 6 029 857 | 0.3 | - |
| other borrowed funds | 170 685 352 | 9.4 | 8.1 |
| of them: | |||
| borrowed funds of non-residents | 37 564 036 | 2.1 | 2.7 |
A main share of investments in fixed capital in January-February 2024 accounted for industry (48%) (including mining and quarrying - 30.7%, manufacturing industry - 11.5%), operations with real estate (21.3%), transport and warehousing (13.3%) and agriculture, forestry and fisheries (3.9%).
| Investments in fixed capital, thousand tenge | in % by January-February 2023 | Share in the total volume of investments, as a percentage | |
|---|---|---|---|
| Total | 1 809 357 363 | 107.9 | 100.0 |
| Including: | |||
| Agriculture, forestry and fisheries | 70 373 508 | 111.8 | 3.9 |
| Industry | 868 185 259 | 97.6 | 48.0 |
| Including: | |||
| Mining and quarrying | 554 773 444 | 84.9 | 30.7 |
| Manufacturing industry | 208 443 930 | 136.9 | 11.5 |
| Supply of electricity, gas, steam, hot water and air conditioning | 73 789 852 | 131.6 | 4.1 |
| Water supply; collection, treatment and disposal of waste, activities for the elimination of pollution | 31 178 032 | 106.6 | 1.7 |
| Construction | 29 217 462 | 265.5 | 1.6 |
| Wholesale and retail trade; car and motorcycle repair | 37 501 054 | 102.5 | 2.1 |
| Transport and warehousing | 241 477 881 | 147.0 | 13.3 |
| Provision of accommodation and food services | 20 373 658 | 123.0 | 1.1 |
| Information and communication | 23 250 602 | 144.8 | 1.3 |
| Financial and insurance activities | 22 532 325 | 255.3 | 1.2 |
| Operations with real estate | 384 674 573 | 106.3 | 21.3 |
| Professional, scientific and technical activities | 14 523 639 | 62.5 | 0.8 |
| Administrative and support services activities | 11 153 814 | 125.4 | 0.6 |
| Public administration and defense; compulsory social security | 7 472 276 | 45.6 | 0.4 |
| Education | 30 019 743 | 156.4 | 1.7 |
| Healthcare and social services for the population | 33 683 498 | 77.6 | 1.9 |
| Arts, entertainment and recreation | 13 302 934 | 98.9 | 0.7 |
| Provision of other types of services | 1 615 120 | 91.1 | 0.1 |
Investments in fixed capital - investments in order for investors to obtain an economic, social or environmental ef-fect in the case of new construction, as well as expansion, reconstruction and modernization of facilities (which lead to an increase in the initial cost of the facility), the purchase of machinery, equipment, vehicles, for the formation of the main herd, perennial plantings, etc.
The costs of construction and installation works and capital repairs include the costs of a complex of works on the construction of buildings and structures, expansion, reconstruction, installation of energy, technological and other equip-ment, as well as the costs of capital repairs of non-residential, residential buildings and structures.
The cost of purchasing machinery and equipment - an element of the technological structure of investments, in-cluding the cost of purchasing machinery, vehicles, equipment.
Other costs in the volume of investments in fixed capital – the costs of design and survey work, supervision, maintenance of directorates of objects under construction, the costs of cultivated biological costs, as well as the costs of objects created or acquired by organizations used in economic activity for more than one year, having a monetary valua-tion, having the ability to alienate and generating income, but which are not material values.
The index of the physical volume of investments in fixed capital characterizes the change in investment invest-ments in dynamics, is determined by the ratio of the volume of investments in fixed capital in the reporting and compared period at comparable prices
Statistical information on investments in fixed capital is formed on the basis of primary statistical data of national statistical observations of economic entities engaged in investment activities (regardless of the number of employees and type of economic activity) and national statistical observations on the commissioning of facilities by individual developers.
Accounting of investment investments is provided at the place of actual implementation, regardless of the place of registration of the economic entity engaged in investment activities.
Operational data on investments in fixed capital, formed on a monthly basis, are updated with annual data.
By types of economic activity, data on investments in fixed capital are formed according to the direction of use (depends on the nature of the direction of investment (end use) and by the type of economic activity of the investor.
More detailed methodological explanations are available at the following link:
Methodology for the formation of indicators of investment activity statisticsStatistical compilation "Investment and construction activities in the Republic of Kazakhstan"


