Bureau of National Statistics
of the Agency for Strategic Planning and Reforms of the Republic of Kazakhstan
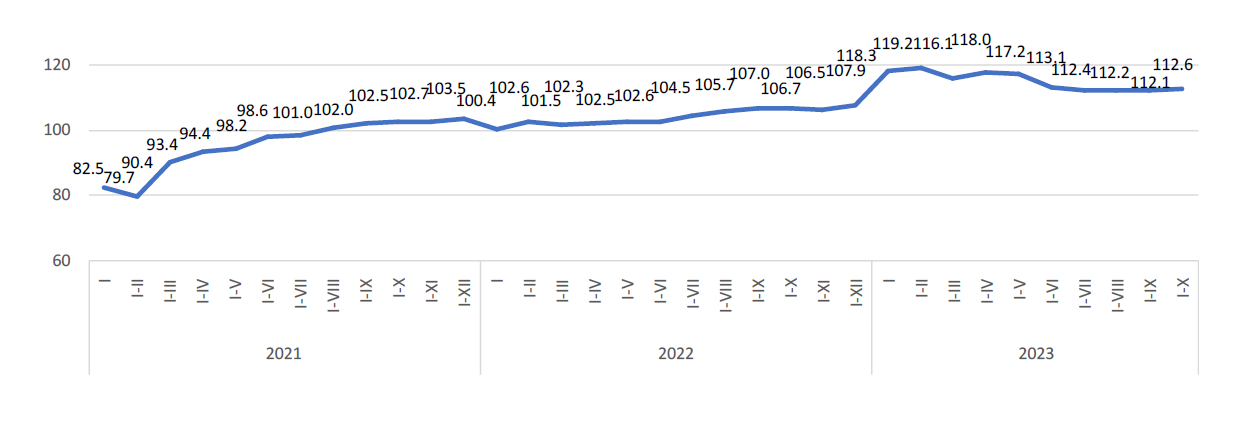
Since August 2021, the volume of investments has been steadily increasing positively in comparison with the corre-sponding period last year.
The significant share of investments falls on Atyrau region (18.3%).
| October 2023 to | January-October 2023 by January-October 2022 | ||
| September 2023 | October 2022 | ||
| Republic of Kazakhstan | 85.0 | 115.8 | 112.6 |
| Abai | 104.6 | 217.8 | 144.2 |
| Akmola | 92.4 | 70.9 | 107.0 |
| Aktobe | 105.4 | 112.3 | 108.2 |
| Almaty | 159.8 | 157.6 | 111.0 |
| Atyrau | 65.9 | 92.9 | 99.0 |
| Batys Kazakhstan | 81.0 | 119.1 | 122.2 |
| Zhambyl | 109.4 | 266.2 | 111.8 |
| Zhetisu | 46.3 | 93.6 | 119.8 |
| Karagandy | 63.8 | 118.2 | 116.5 |
| Kostanai | 90.7 | 101.9 | 107.4 |
| Kyzylorda | 112.6 | 141.5 | 127.7 |
| Mangystau | 196.9 | 158.0 | 144.7 |
| Pavlodar | 79.8 | 96.4 | 128.2 |
| Soltustik Kazakhstan | 56.7 | 165.1 | 120.3 |
| Turkistan | 46.4 | 191.0 | 141.3 |
| Ulytau | 58.2 | 129.9 | 122.4 |
| Shygys Kazakhstan | 71.3 | 100.2 | 103.1 |
| Astana city | 86.7 | 91.3 | 103.1 |
| Almaty city | 112.4 | 125.3 | 104.2 |
| Shymkent city | 114.5 | 100.6 | 122.0 |
About half of the national volume of capital investments is carried out by large and medium-sized enterprises.
| Mastered investments in fixed capital | Including | |||
| small businesses | medium -sized enterprises | large enterprises | ||
| January-October 2021 | 9 967 839 316 | 5 397 709 844 | 836 862 361 | 3 733 267 111 |
| January-October 2022 | 11 244 223 209 | 6 039 317 129 | 556 425 535 | 4 648 480 545 |
| January-October 2023 | 13 333 304 268 | 7 225 744 625 | 878 607 828 | 5 228 951 815 |
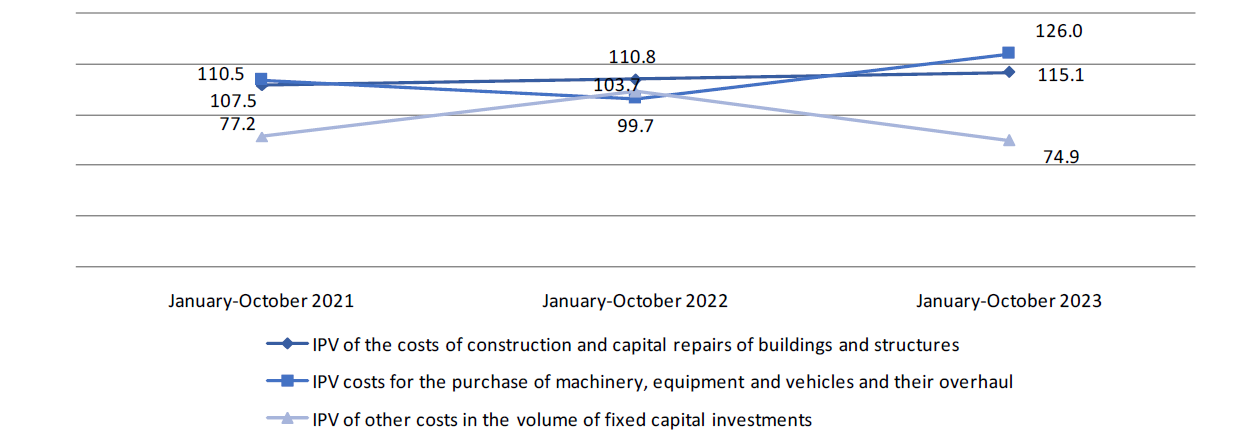
60.2% of the total costs are for construction and major repairs of buildings and structures, more than a quarter of the total amount is for the purchase of machinery, equipment and vehicles.
The predominant sources of investment financing remain the own funds of economic entities, the volume of which in January-October 2023 amounted to 9994.9 billion tenge or 75% of the total.
Budget funds accounted for 14.6% of the total investment in fixed capital, while compared with January-October 2022 increased by 19.2%.
For the banking sector, the financing of the real sector of the economy in the total volume of investments in fixed capital takes 2.6%.
| January-October 2023 | For reference: as a percentage of the total | |||
| thousand tenge | as a percentage of the total | January-October 2022 | January-October 2021 | |
| Investments in fixed capital | 13 333 304 268 | 100.0 | 100.0 | 100.0 |
| including at the expense of funds: | ||||
| state budget | 1 947 229 956 | 14.6 | 13.8 | 14.1 |
| Ownfunds | 9 994 876 522 | 75.0 | 74.6 | 71.7 |
| Bankloans | 345 852 580 | 2.6 | 2.4 | 2.6 |
| of them: | ||||
| loans from foreign banks | 14 444 857 | 0.1 | 0.2 | 0.6 |
| other borrowed funds | 1 045 345 210 | 7.8 | 9.2 | 11.6 |
| of them: | ||||
| borrowed funds of non-residents | 350 487 027 | 2.6 | 1.9 | 2.0 |
A main share of investments in fixed capital in January-October 2023 accounted for industry (47.5%) (including mining and quarrying - 28.8%, manufacturing industry - 9.2%), operations with real estate (18.5%), transport and warehousing (13.6%) and agriculture, forestry and fisheries (5.8%).
| Investments in fixed capital, thousand tenge | in % by January-October 2022 | Share in the total volume of investments, as a percentage | |
| Total | 13 333 304 268 | 112,6 | 100,0 |
| Including: | |||
| Agriculture, forestry and fisheries | 778 180 838 | 108,7 | 5,8 |
| Industry | 6 330 888 114 | 108,3 | 47,5 |
| Including: | |||
| Mining and quarrying | 3 836 611 862 | 102,1 | 28,8 |
| Manufacturing industry | 1 230 907 488 | 100,8 | 9,2 |
| Supply of electricity, gas, steam, hot water and air conditioning | 853 561 865 | 160,5 | 6,4 |
| Water supply; collection, treatment and disposal of waste, activities for the elimination of pollution | 409 806 905 | 128,4 | 3,1 |
| Construction | 149 377 410 | 92,4 | 1,1 |
| Wholesale and retail trade; car and motorcycle repair | 364 108 036 | 137,6 | 2,7 |
| Transport and warehousing | 1 811 127 573 | 158,0 | 13,6 |
| Provision of accommodation and food services | 108 531 436 | 111,4 | 0,8 |
| Information and communication | 155 113 661 | 133,8 | 1,2 |
| Financial and insurance activities | 87 308 325 | 92,2 | 0,7 |
| Operations with real estate | 2 462 662 925 | 100,4 | 18,5 |
| Professional, scientific and technical activities | 61 213 403 | 145,8 | 0,5 |
| Administrative and support services activities | 127 262 282 | 112,8 | 1,0 |
| Public administration and defense; compulsory social security | 114 619 856 | 116,0 | 0,9 |
| Education | 319 085 159 | 118,1 | 2,4 |
| Healthcare and social services for the population | 247 132 520 | 139,8 | 1,9 |
| Arts, entertainment and recreation | 171 260 370 | 114,0 | 1,3 |
| Provision of other types of services | 45 432 197 | 67,5 | 0,3 |
Investments in fixed capital - investments in order for investors to obtain an economic, social or environmental ef-fect in the case of new construction, as well as expansion, reconstruction and modernization of facilities (which lead to an increase in the initial cost of the facility), the purchase of machinery, equipment, vehicles, for the formation of the main herd, perennial plantings, etc.
The costs of construction and installation works and capital repairs include the costs of a complex of works on the construction of buildings and structures, expansion, reconstruction, installation of energy, technological and other equip-ment, as well as the costs of capital repairs of non-residential, residential buildings and structures.
The cost of purchasing machinery and equipment - an element of the technological structure of investments, in-cluding the cost of purchasing machinery, vehicles, equipment.
Other costs in the volume of investments in fixed capital – the costs of design and survey work, supervision, maintenance of directorates of objects under construction, the costs of cultivated biological costs, as well as the costs of objects created or acquired by organizations used in economic activity for more than one year, having a monetary valua-tion, having the ability to alienate and generating income, but which are not material values.
The index of the physical volume of investments in fixed capital characterizes the change in investment invest-ments in dynamics, is determined by the ratio of the volume of investments in fixed capital in the reporting and compared period at comparable prices
Statistical information on investments in fixed capital is formed on the basis of primary statistical data of national statistical observations of economic entities engaged in investment activities (regardless of the number of employees and type of economic activity) and national statistical observations on the commissioning of facilities by individual developers.
Accounting of investment investments is provided at the place of actual implementation, regardless of the place of registration of the economic entity engaged in investment activities.
Operational data on investments in fixed capital, formed on a monthly basis, are updated with annual data.
By types of economic activity, data on investments in fixed capital are formed according to the direction of use (depends on the nature of the direction of investment (end use) and by the type of economic activity of the investor.
More detailed methodological explanations are available at the following link:
Methodology for the formation of indicators of investment activity statisticsStatistical compilation "Investment and construction activities in the Republic of Kazakhstan"


