Bureau of National Statistics
of the Agency for Strategic Planning and Reforms of the Republic of Kazakhstan
| Bakery products and cereals | Meat and meat products | Fish and seafood |
Milk and dairy products |
Eggs (pieces) | Oils and Fats | Fruits | Vegetables | Potatoes | Sugar, jam, honey, chocolate, confectionery | ||||||
| Republic of Kazakhstan | 30,6 | 19,5 | 3,4 | 55,4 | 50,4 | 3,9 | 16,0 | 17,5 | 11,2 | 10,5 | |||||
| Abai | 28,9 | 18,1 | 3,3 | 55,4 | 52,8 | 3,6 | 13,5 | 13,8 | 7,7 | 9,0 | |||||
| Akmola | 30,1 | 22,0 | 4,3 | 69,4 | 64,4 | 5,0 | 17,8 | 15,2 | 11,5 | 11,9 | |||||
| Аktobе | 28,8 | 17,3 | 2,9 | 44,7 | 43,6 | 3,8 | 13,8 | 14,4 | 10,1 | 10,7 | |||||
| Аlmaty | 36,1 | 21,7 | 3,4 | 45,4 | 43,2 | 3,3 | 14,2 | 16,4 | 10,3 | 11,4 | |||||
| Аtyrau oblysy | 30,1 | 21,8 | 4,5 | 44,8 | 43,3 | 3,6 | 11,3 | 13,8 | 10,0 | 9,3 | |||||
| Batys Kazakhstan | 32,7 | 21,7 | 4,4 | 51,3 | 46,4 | 4,1 | 16,9 | 18,4 | 13,2 | 9,8 | |||||
| Zhambyl | 34,2 | 22,7 | 3,5 | 57,0 | 44,6 | 4,4 | 15,0 | 17,3 | 12,3 | 11,6 | |||||
| Zhetisu | 32,8 | 20,9 | 3,2 | 48,5 | 41,9 | 3,5 | 15,1 | 18,7 | 9,9 | 11,9 | |||||
| Кaragandy | 25,8 | 18,9 | 3,3 | 63,0 | 66,0 | 4,4 | 17,2 | 14,4 | 11,6 | 11,0 | |||||
| Коstanai | 28,1 | 18,8 | 4,2 | 50,3 | 59,8 | 3,9 | 16,0 | 19,0 | 13,3 | 10,7 | |||||
| Кyzylorda | 30,8 | 15,2 | 4,0 | 40,8 | 41,9 | 3,8 | 12,1 | 14,7 | 10,8 | 9,9 | |||||
| Мangystau | 23,4 | 22,9 | 2,4 | 58,1 | 42,0 | 4,6 | 23,4 | 19,3 | 12,5 | 9,1 | |||||
| Pavlodar | 31,3 | 21,5 | 3,4 | 59,4 | 47,3 | 4,0 | 16,3 | 17,2 | 12,5 | 10,8 | |||||
| Soltustik Кazakhstan | 27,4 | 19,8 | 4,4 | 57,2 | 64,2 | 3,6 | 16,7 | 14,4 | 11,2 | 10,5 | |||||
| Turkistan | 41,1 | 16,3 | 3,0 | 55,2 | 42,8 | 4,8 | 14,3 | 22,7 | 10,9 | 10,4 | |||||
| Ulytau | 33,0 | 19,9 | 2,9 | 69,3 | 65,8 | 5,8 | 19,3 | 16,4 | 12,9 | 15,6 | |||||
| Shygys Kazakhstan | 28,5 | 21,2 | 4,8 | 69,8 | 54,0 | 3,6 | 17,7 | 15,1 | 10,5 | 10,4 | |||||
| Astana city | 24,6 | 18,3 | 3,1 | 60,8 | 61,5 | 2,9 | 19,2 | 17,8 | 11,6 | 8,4 | |||||
| Almaty city | 24,3 | 21,0 | 3,7 | 67,7 | 56,7 | 3,9 | 19,3 | 20,2 | 12,3 | 11,8 | |||||
| Shymkent city | 32,0 | 15,0 | 1,5 | 41,5 | 44,9 | 3,3 | 12,4 | 17,1 | 9,6 | 8,5 | |||||
| Bakery products and cereals | Meat and meat products | Fish and seafood |
Milk and dairy products |
Eggs (pieces) | Oils and Fats | Fruits | Vegetables | Potatoes |
Sugar, jam, honey, chocolate, confectionery product |
|
| 2019 | 136,3 | 78,9 | 14,6 | 253,5 | 194,3 | 17,1 | 77,4 | 86,6 | 48,5 | 42,9 |
| І quarter | 34,4 | 19,5 | 3,5 | 63,0 | 47,1 | 4,4 | 15,7 | 19,1 | 12,1 | 10,7 |
| II quarter | 33,6 | 19,1 | 3,6 | 63,3 | 49,4 | 4,2 | 15,3 | 20,3 | 11,7 | 10,7 |
| III quarter | 34,0 | 19,9 | 3,5 | 63,9 | 48,4 | 4,1 | 28,5 | 24,7 | 12,1 | 11,0 |
| IV quarter | 34,3 | 20,3 | 3,9 | 62,4 | 48,7 | 4,3 | 17,8 | 22,2 | 12,6 | 10,4 |
| 2020 | 140,3 | 83,7 | 15,1 | 259,4 | 199,1 | 17,3 | 78,7 | 86,4 | 50,1 | 43,0 |
| І quarter | 35,4 | 21,0 | 3,7 | 66,2 | 49,7 | 4,3 | 17,0 | 19,4 | 12,9 | 10,9 |
| II quarter | 35,0 | 20,3 | 3,8 | 66,0 | 50,4 | 4,4 | 15,9 | 21,1 | 12,1 | 10,8 |
| III quarter | 35,0 | 21,3 | 3,7 | 64,7 | 50,4 | 4,3 | 27,9 | 24,9 | 12,7 | 11,0 |
| IV quarter | 35,5 | 21,3 | 4,0 | 63,4 | 49,2 | 4,3 | 18,0 | 21,2 | 12,5 | 10,6 |
| 2021 | 133,8 | 82,3 | 14,8 | 243,2 | 193,9 | 16,2 | 76,8 | 80,6 | 46,3 | 44,0 |
| І quarter | 32,6 | 19,8 | 3,4 | 57,7 | 46,3 | 3,9 | 15,5 | 17,9 | 11,6 | 10,4 |
| II quarter | 33,3 | 20,2 | 3,8 | 61,3 | 49,1 | 4,2 | 15,9 | 19,9 | 11,5 | 11,0 |
| III quarter | 33,6 | 20,9 | 3,6 | 61,9 | 49,6 | 4,1 | 28,4 | 22,9 | 11,6 | 11,6 |
| IV quarter | 34,3 | 21,3 | 4,0 | 62,2 | 48,8 | 4,0 | 17,1 | 19,9 | 11,7 | 11,1 |
| 2022 | 128,0 | 78,2 | 14,1 | 226,4 | 194,6 | 15,7 | 73,0 | 77,6 | 45,0 | 41,1 |
| І quarter | 32,5 | 19,8 | 3,5 | 56,3 | 47,2 | 3,9 | 15,6 | 17,4 | 11,4 | 10,3 |
| II quarter | 31,8 | 19,0 | 3,5 | 58,0 | 48,9 | 3,9 | 15,0 | 19,1 | 11,2 | 10,2 |
| III quarter | 31,7 | 19,3 | 3,4 | 56,3 | 48,4 | 3,9 | 26,0 | 22,0 | 11,1 | 10,4 |
| IV quarter | 32,0 | 20,1 | 3,7 | 55,4 | 49,4 | 3,9 | 16,4 | 19,1 | 11,2 | 10,4 |
| 2023 | ||||||||||
| І quarter | 30,6 | 19,5 | 3,4 | 55,4 | 50,4 | 3,9 | 16,0 | 17,5 | 11,2 | 10,5 |
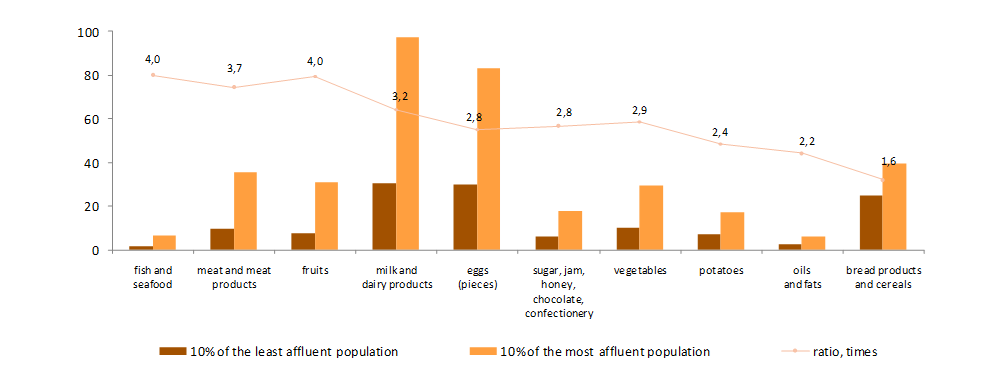
In the reporting period, 10% of the least affluent population compared to 10% of the most affluent population consumed fruits, fish and seafood 4 times less, meat and meat products – 3.7 times, milk and dairy products - 3.2 times.
Household housekeeping – a extraveconomical subject, living in one or the other physical person, living in a shuttle, sharing in or part of its income and property, and in a shuttle consuming cargo and services.
Main consumption of the main product queries, in the average population-quantity of product queries (separate by type of product), consumption in the average member of the household consumption for a variable length of time. On the other hand, we calculate the putem divisions to be used by the species of the species and the species of the species to be used by the species of the species. Below, a group consumption group is split into four groups representing a particular product.
Data on the survey of population budgets by standard of living are formed on a quarterly and annual basis, based on surveys of 12,000 households, in accordance with the Methodology of organizations and conducting a sample survey of households by standard of living, approved by Order No. 31 of the Chairman of the Committee on Statistics of the Ministries of National Economy of Kazakhstan dated July 2, 2020, registered with the Ministry of Justice Of the Republic of Kazakhstan on July 3, 2020 No. 20922, with the methodology of the constructed sample of households on the survey of living standards, last week the chairman of the committee on statistics Ministries of the National Canberrans of Kazakhstan from December 14, 2015 to apostille 202.


