Bureau of National Statistics
of the Agency for Strategic Planning and Reforms of the Republic of Kazakhstan
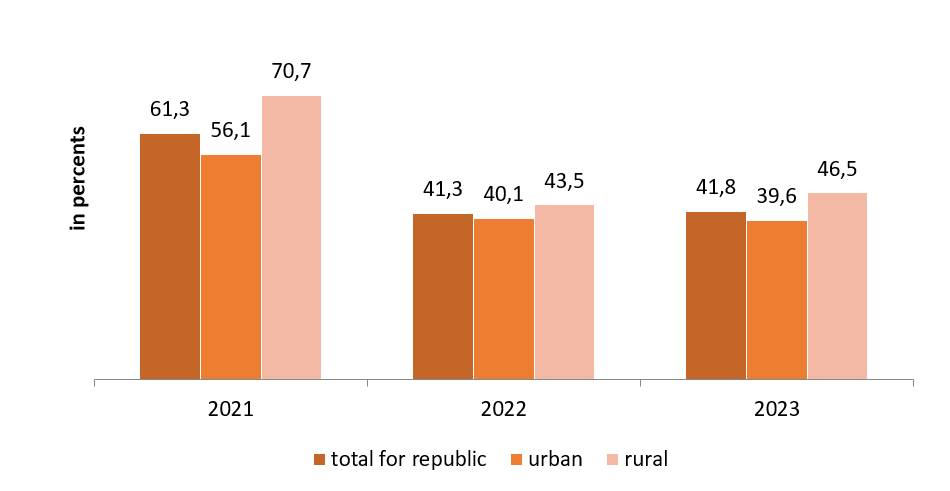
Сompared with a similar survey of the 2022, the level of satisfaction with the life of respondents increased by 0.5 percentage points (in 2022 – 41.3%). The level of satisfaction the life 2023 below level 2021 by 19.5 percentage points (in 2021 – 61.3%).
47.6% of respondents are satisfied with their health, -49.3% are partially satisfied. At the same time, the older the respondents, the lower the proportion of those satisfied with their health and among respondents at retirement age, such is 2.6 times less than among the age group of 15-17 years. At the same time, in comparison with the results of the survey of the previous year, the level of satisfaction of respondents with their health increased by 0.4 percentage points (in 2022 – 47.2%).
It should be noted that out of the proposed list of providers of basic public services, respondents are most satisfied with the quality of services provided by Emergency Medical Centers – 56.1% of respondents.
The level of satisfaction of respondents with their financial situation in the current year increased by 2 percentage points compared to the previous year and amounted to 34%.
According to the level of material security (affluence), 72.2% of respondents attributed themselves to the average level of security (middle class), 0.3% of respondents indicated a low level of security and 1% of respondents attributed themselves to a high level of security. In general, the dynamics of this indicator shows an increase in the share of the average level of security at the expense of other levels of security, both lower and high levels.
The main reasons for the low and below-average level of household security are low wages of 92.7% and a low pension of 1.4%. Depending on the employment status, 94.4% of the working population cited low wages as the main reason, while the main reason for the unemployed, respectively, is the absence of any paid work of 78.5%.
| Total | By type of area | Including by employment status | ||||
|---|---|---|---|---|---|---|
| urban | rural | employed | self-employed | unemployed | ||
| Total respondents | 100,0 | 100,0 | 100,0 | 100,0 | 100,0 | 100,0 |
| Including reasons*: | ||||||
| no paid work | 0,9 | 0,6 | 1,5 | 0,9 | 0,8 | 78,5 |
| inability to find a permanent paid job at the place of residence | 0,8 | 0,4 | 1,5 | 0,7 | 1,3 | 3,7 |
| insufficient level of qualification and/or work experience | 0,6 | 0,6 | 0,7 | 0,6 | 0,6 | 1,1 |
| low wages | 92,7 | 93,0 | 91,7 | 94,4 | 93,8 | 5,1 |
| low pension | 1,4 | 1,4 | 1,3 | 0,4 | 0,4 | 2,5 |
| low social allowance | 0,9 | 1,0 | 0,8 | 0,7 | 0,7 | 0,8 |
| the presence of an excess debt burden associated with the payment of loans and borrowings, Including mortgage | 0,9 | 0,8 | 1,0 | 1,0 | 1,0 | 2,0 |
| insufficient level of education to get a suitable job | 0,5 | 0,6 | 0,4 | 0,5 | 0,6 | 2,5 |
| the presence of socially inadequate family members (suffering from alcoholism, drug addiction, and so on) and / or the presence of persons with disabilities in the household | 0,2 | 0,2 | 0,1 | 0,1 | … | 0,6 |
| poor health condition | 0,8 | 1,0 | 0,6 | 0,4 | 0,7 | 2,1 |
| emergencies, natural disasters (crop failure, fires, floods, loss of loved ones, and so on) | 0,0 | 0,0 | 0,0 | 0,0 | … | … |
| loss of property due to theft, robbery, cattle rustling, etc. | 0,0 | 0,0 | 0,1 | … | … | … |
| the need to supervise and / or care for a child (children) of preschool age who do not attend a preschool institution | 0,2 | 0,3 | 0,1 | 0,2 | 0,1 | 1,1 |
| another reason | 0,1 | 0,1 | 0,2 | 0,1 | … | … |
According to the survey results, 20.5% of respondents noted the option of being able to purchase housing on their own, 40.1% - partially, while 22.5% of respondents indicated that they were satisfied with the state's support in housing improvement (improvement of housing conditions).
More than half of respondents (63.4%) indicated that they are confident in the moral support of relatives or acquaintances, while villagers are more satisfied that they will receive moral support if necessary than urban residents (64.8% and 62.7%, respectively).
42.4% of respondents are confident about their positive future in the future, 34.7% assume that there will be an improvement in the future, and only 0.8% of respondents think that they will live worse.
A household is an economic entity consisting of one or more individuals living together, combining all or part of their income and property, and jointly consuming goods and services;
Quality of life is an interdisciplinary concept that characterizes the effectiveness of all aspects of human life, the level of satisfaction of material, spiritual and social needs, the level of intellectual, cultural and physical development, as well as the degree of ensuring the safety of life;
Satisfaction is a positive assessment of various aspects of life that are of particular importance to a person;
Life satisfaction is a way in which people show their emotions, feelings, as well as a measure of well–being, assessed in terms of mood, satisfaction with relationships, goals achieved;
Deprivation is a reduction or complete deprivation of the possibility of satisfying needs - psychophysiological or social.
The purpose of the survey is to obtain data on the subjective assessment of respondents, reflecting the characteristics of the standard of living of the population.
The survey on this module is an integral part of the program of sample surveys of households to assess the standard of living.
The survey is carried out in all regions of the republic, the cities of Asana, Almaty and Shymkent. Data collection is carried out by filling out questionnaires by respondents, while respondents in the survey are one household member aged 15 years and older.
The satisfaction scale (from 1 to 10) is used as an answer to the questions. This practice is widely used by Eurostat, the Organization for Economic Cooperation and Development (OECD), and is also recommended by the Conference of European Statisticians, which allows for international comparability of the results of this observation.
The satisfaction scale is divided into the following categories: scales 1-3 – "not satisfied", scales 4-7 – "partially satisfied" and scales 8-10 – "satisfied", and there was also an answer option "I find it difficult to answer and not applicable".


